Voltar
Contents
O que é o Indicador de Amplitude: Visão Geral, Exemplos

Demetris Makrides
Senior Business Development Manager

Vitaly Makarenko
Chief Commercial Officer
Indicadores de Amplitude são a categoria de instrumentos de análise tecnológica que ajudam os traders a entender a situação geral do mercado e a prever futuras reversões de tendência. Indicadores de amplitude são amplamente utilizados em diferentes mercados financeiros.
Principais conclusões:
- Qual é a noção central de um Indicador de Amplitude?
- Quais instrumentos a categoria de indicadores de amplitude inclui?
- Quais são os prós e contras dos indicadores de amplitude?
- Como usar indicadores de amplitude corretamente?
- Com quais instrumentos técnicos os instrumentos Breadth são combinados?
O que é Amplitude de Mercado e como calculá-la?
Ao falar sobre os indicadores de amplitude, esses instrumentos ajudam os traders a entender a amplitude atual do mercado. O que isso significa? Vamos esclarecer o termo aplicado a ações negociadas na NASDAQ, por exemplo.
Em um dia de negociação, algumas ações caem enquanto outras sobem de preço. A amplitude do mercado é a diferença entre o número de ações em alta e o número de ações que perderam valor em um dia de negociação. Quando o número de ações em alta é maior que o número de ações em queda, a amplitude do mercado é positiva, e vice-versa.
Os indicadores de amplitude são baseados no número de ações em alta ou em queda. O valor geralmente é expresso como:
- a diferença entre o número de ações em alta e em baixa;
- a proporção entre o número de ações em alta e as em baixa;
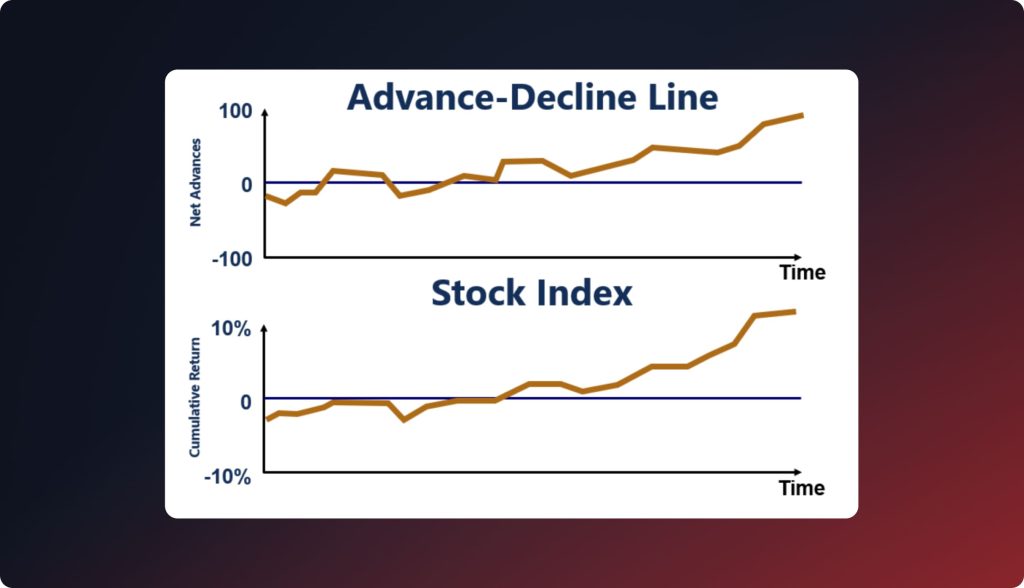
- a linha de avanço/declínio que é entendida como o valor cumulativo da diferença entre o número de ações em avanço e em declínio.
Com base nas possíveis representações acima mencionadas da amplitude do mercado, existem vários tipos de indicadores.
Os tipos de indicadores de amplitude
Quando falamos sobre os tipos de indicadores de amplitude, existem dezenas de instrumentos, mais ou menos difundidos; entretanto, podemos destacar alguns instrumentos que são muito utilizados na análise de tecnologia:
- ADP (Porcentagem de Avanço/Declínio). A porcentagem de ativos em avanço com um determinado cluster ou setor.
- HLP (Percentual Alto/Baixo). A porcentagem de ativos em alta ou em queda que atingiram suas máximas/mínimas em 52 semanas.
- Porcentagem acima da EMA200. A porcentagem de ativos que estão acima da linha da EMA 200.
- ADL (Linha de Avanço/Declínio). A linha que representa a diferença geral entre o número de ativos em avanço e em declínio.
Vamos nos aprofundar nos tipos fornecidos para entender melhor como os indicadores de amplitude funcionam e o que os traders obtêm com esses instrumentos.
ADP (Porcentagem de Avanço/Declínio)
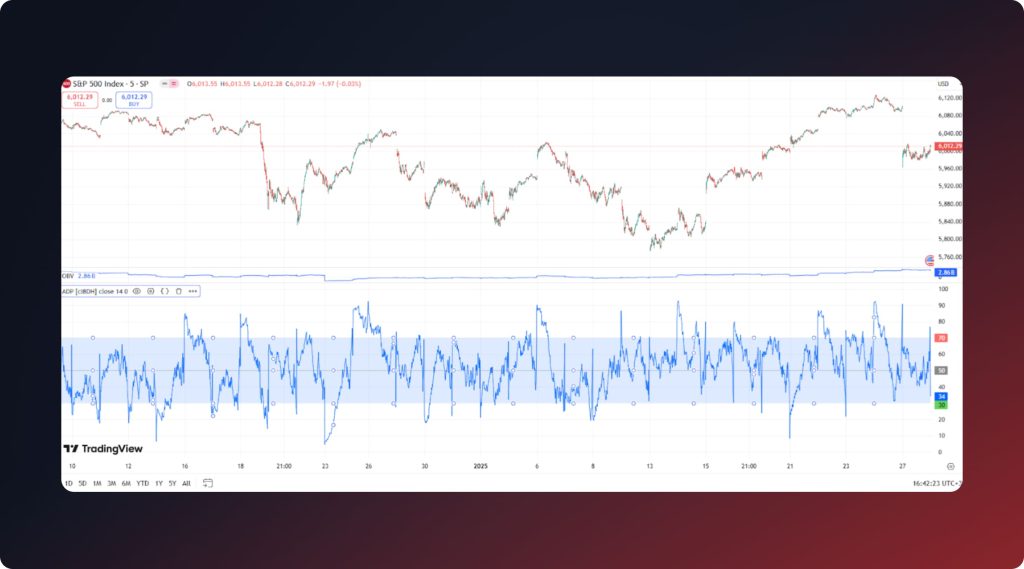
O ADP é um indicador de amplitude de mercado que mostra a diferença percentual entre o número de ativos em alta e em baixa. A porcentagem é calculada diariamente. Usando o indicador de Porcentagem de Avanço/Declínio, os traders entendem se os touros ou os ursos dominam o mercado e quão fortes são suas posições.
Por exemplo, podemos calcular o valor do ADP para ações do S&P 500. Em um dia de negociação, 320 ações do S&P 500 estão subindo e outras 180 estão caindo. Para calcular a porcentagem, precisamos usar a seguinte fórmula:
ADP = (NA – ND) / ON)
- NA – o número de ativos adiantados;
- ND – o número de ativos em declínio;
- ON – o número total de ativos.
Assim, a porcentagem de avanço/declínio para as ações do S&P 500 é a seguinte: (320-180)/500. Obtemos 0,28 ou 28%.
HLP (Alto/Baixo Percentual)
HLP é o indicador que leva em conta quantos ativos atingiram suas máximas e mínimas de 52 semanas. O indicador mostra os dados calculados diariamente. Os traders obtêm informações suficientes para identificar a tendência atual do mercado.
Por exemplo, 25 ações do S&P 500 atingiram novas máximas e nenhuma ação caiu para as mínimas de 52 semanas. Precisamos usar a seguinte fórmula:
HLP = (NH – NL) / ON
- NH – o número de ativos que atingiram suas máximas de 52W;
- NL – o número de ativos que atingiram suas mínimas de 52W;
- ON – número total de ativos no setor ou índice.
Quando falamos de ações do S&P 500 temos os seguintes resultados: (25 – 0) / 500 = 0,05 ou 5%.
Porcentagem acima da EMA 200
O indicador Percentual acima da MME 200 mostra quantos ativos estão acima da linha da MME 200. Assim como o Percentual Máximo/Mínimo, este indicador se enquadra na categoria de indicadores de tendência e fornece aos traders sinais de atraso. Ao mesmo tempo, o uso da Média Móvel Exponencial em vez da simples torna esses sinais mais precisos.
Por exemplo, 70 ações do S&P estão acima de suas linhas EMA 200, o que significa que a porcentagem acima do índice EMA 200 é 70/500 = 0,14 ou 14%.
Linha AD (Avanço/Declínio)
A linha AD é um indicador tecnológico que mostra a diferença diária entre o número de ativos em alta e em baixa.
Portanto, apesar da grande variedade de tipos diferentes, o objetivo do indicador de amplitude é o mesmo: informar os comerciantes/investidores sobre a diferença entre o número de ativos em alta e em baixa dentro de um grupo, cluster, mercado, etc.
O que os traders ganham com os indicadores de amplitude?
Por que os traders profissionais usam indicadores de amplitude e por que eles são úteis o suficiente?
- Os indicadores de amplitude ajudam os traders a entender o "humor" geral do mercado. Com base nos dados recebidos, os traders podem interpretar facilmente se os touros ou os ursos controlam o mercado no momento.
- Esses indicadores permitem que os traders identifiquem a tendência atual e sua força. Além disso, os indicadores de amplitude mostram as remoções de tendência em andamento.
Ao falar sobre análise de tecnologia, muitos instrumentos de alta classificação são de alguma forma baseados em indicadores de amplitude (OBV, Oscilador de Chaikin, etc.):
Prós e contras dos indicadores de amplitude
Os indicadores de amplitude são caracterizados pelos seguintes pontos fortes:
- Os traders obtêm dados suficientes para identificar a tendência atual do mercado e entender se os sentimentos de alta ou baixa dominam o mercado.
- Além da direção da tendência, os indicadores de amplitude ajudam os traders a determinar a força da tendência atual.
Ao falar sobre os contras, os seguintes são apontados:
- Em primeiro lugar, os indicadores de amplitude não levam em consideração ativos que não estão incluídos em um determinado grupo ou cluster. Em caso de exclusão de ativos desse grupo ou cluster, os indicadores podem fornecer sinais falsos aos traders.
- Os indicadores atribuem peso igual a todos os ativos, independentemente da capitalização de mercado. Eis o motivo pelo qual tal instrumento é menos sensível a variações afetadas por ativos com alta capitalização de mercado.
Quais instrumentos de tecnologia combinar com indicadores de amplitude?
Por mais úteis que sejam os indicadores de amplitude, os traders profissionais preferem combiná-los com outros instrumentos tecnológicos para obter sinais de negociação mais precisos. Quais são os instrumentos mais frequentemente combinados com indicadores de amplitude?
- RSI. O indicador ajuda a identificar as áreas onde um ativo está sobrecomprado/sobrevendido.
- MA. Diferentes médias móveis são amplamente utilizadas para comprovar a direção atual do mercado e sua força.
- Bandas de Bollinger. O instrumento ajuda os traders a entender quais rompimentos são sinais de movimentos bruscos de tendência.
Conclusão: Os indicadores de amplitude são úteis para um trader?
Indicadores de amplitude podem ser entendidos como um fundamento que permite ao trader compreender a situação geral do mercado. Essa categoria de instrumentos tecnológicos ajuda os traders a determinar a tendência atual, sua força e a possibilidade de reversão em curso. Para obter sinais de negociação precisos, deve-se usar indicadores de amplitude em combinação com outros instrumentos de análise tecnológica.
Atualizado:
6 de fevereiro de 2025