
La media móvil ponderada es un tipo de indicador de media móvil que asigna un valor a cada nivel de precio. Según el instrumento, los precios más recientes obtienen un valor mayor que los iniciales y afectan más al indicador.
Conclusiones clave:
- ¿Cuáles son los tipos de indicador de media móvil?
- ¿Qué significa la media móvil ponderada (WMA)?
- ¿Qué es la fórmula de la media móvil ponderada?
- ¿Cómo utilizar el instrumento WMA?
- ¿Pros y contras del indicador WMA?
- ¿Qué tipo de media móvil es mejor?
Media Móvil. Definición y Tipos del Instrumento
Los indicadores de medias móviles se encuentran entre los instrumentos más utilizados para identificar la tendencia actual del mercado. Estos indicadores son igualmente útiles en diferentes marcos temporales. Además, muchos instrumentos técnicos conocidos, como el MACD y las Bandas de Bollinger, se basan en medias móviles.
El objetivo principal del indicador de media móvil es suavizar las fluctuaciones de precios, reducir el ruido del mercado y permitir a los operadores determinar la tendencia actual. Al reducir el ruido de precios, los operadores obtienen una visión más clara de lo que ocurre en el mercado.
Existen muchos tipos de indicadores de media móvil, y los más comunes son: media móvil simple (SMA), media móvil exponencial (MME) y media móvil ponderada (MAP). Analicemos cada uno en detalle para comprender sus diferencias.
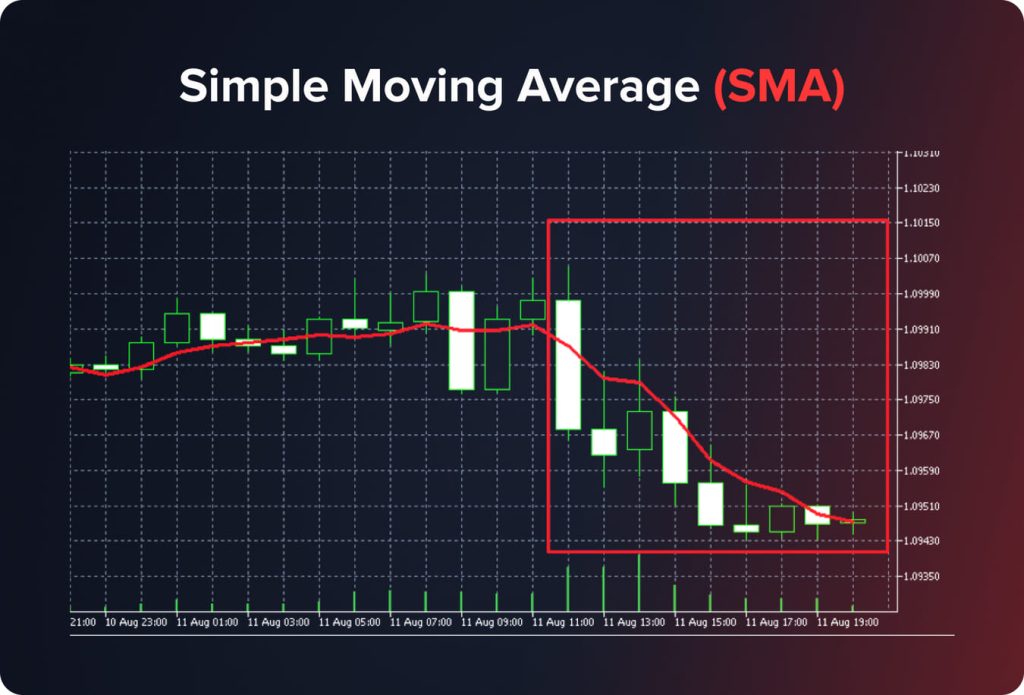
Promedio móvil simple (SMA)
La media móvil simple asigna el mismo valor a todos los niveles de precios. El indicador se basa en los precios de cierre.
Por ejemplo, un operador activa una media móvil simple (SMA) con un período de 5 días. Averigüemos los últimos cinco niveles de precio (precios de cierre) para cada período:
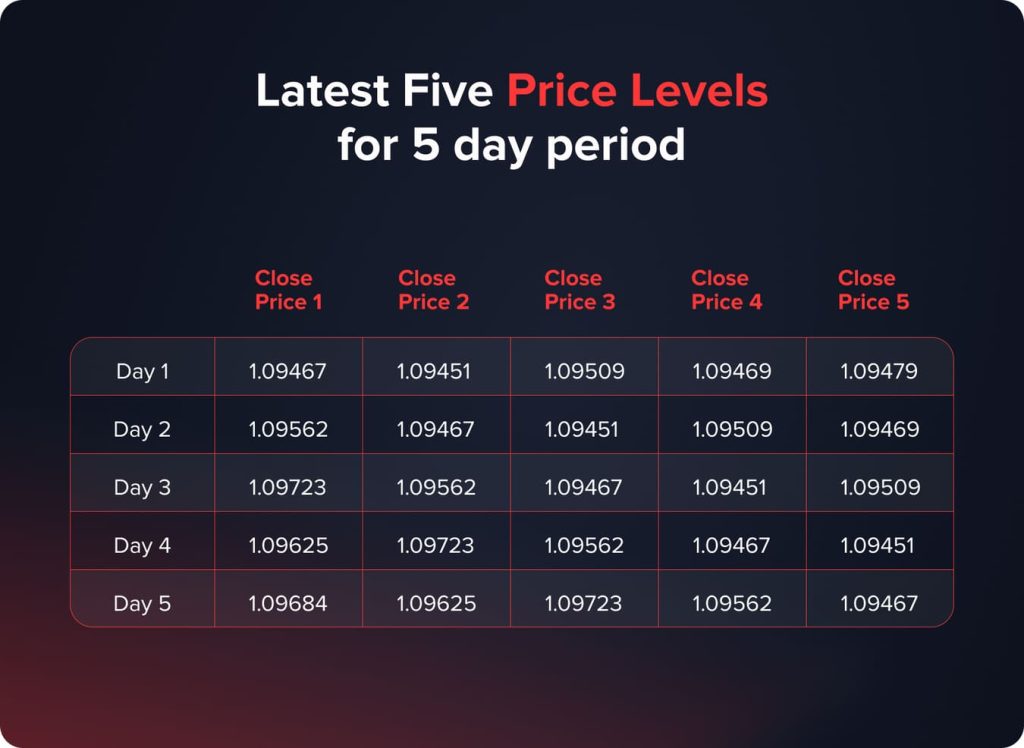
Luego, necesitamos obtener el promedio de cada período: sumamos todos los precios de cierre y los dividimos entre sus valores (5). Como resultado, obtenemos los siguientes valores: 1.09475, 1.09491, 1.09542, 1.09565, 1.09612.
Los valores mencionados anteriormente son puntos a través de los cuales se construye la línea SMA.
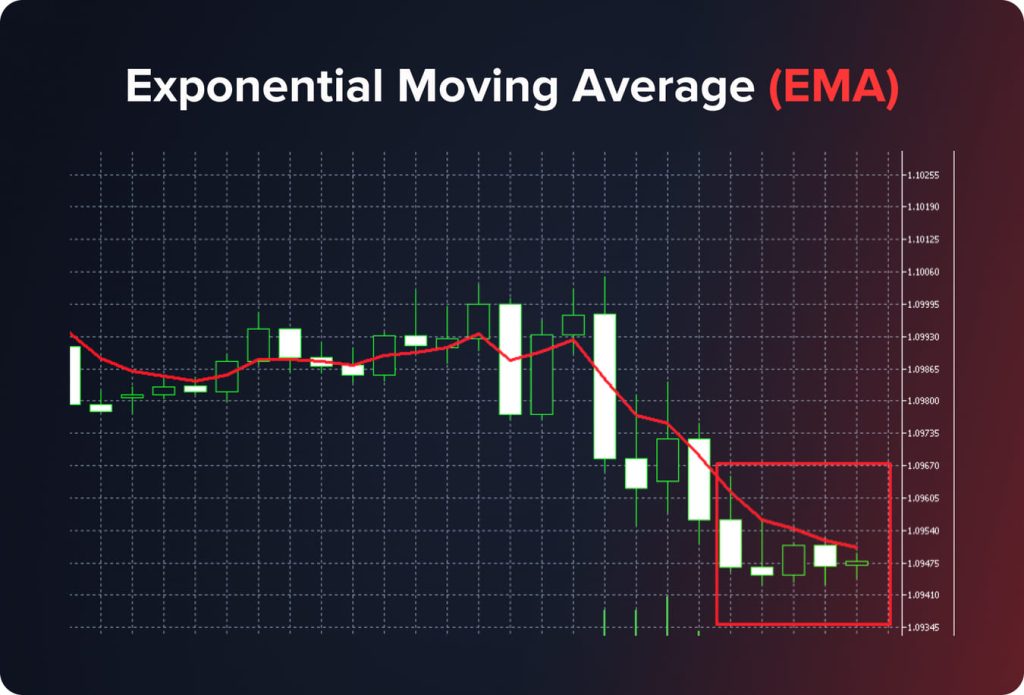
Media móvil exponencial (EMA)
La media móvil exponencial (EMA) otorga mayor valor a los precios más recientes. Por lo tanto, el indicador ayuda a los operadores a identificar cambios de tendencia con mayor rapidez. La EMA se basa en un multiplicador (coeficiente). Este multiplicador se utiliza para suavizar el indicador y dar mayor peso a los períodos posteriores.
El multiplicador se calcula utilizando la siguiente fórmula:
M = (2 / (P + 1)
En esta fórmula, M significa multiplicador y P es la designación del número de períodos.
Para una EMA de 5 días, el multiplicador es (2 / (5+1) = 0,33.
Además, debemos tener en cuenta la fórmula EMA que se ve así:
EMA = (CP * M) + (CP-1 * (1 – M)
CP – precio de cierre;
CP-1 – precio de cierre del período anterior;
M – multiplicador.
Calculemos los valores de EMA para los datos dados en la tabla mencionada anteriormente.
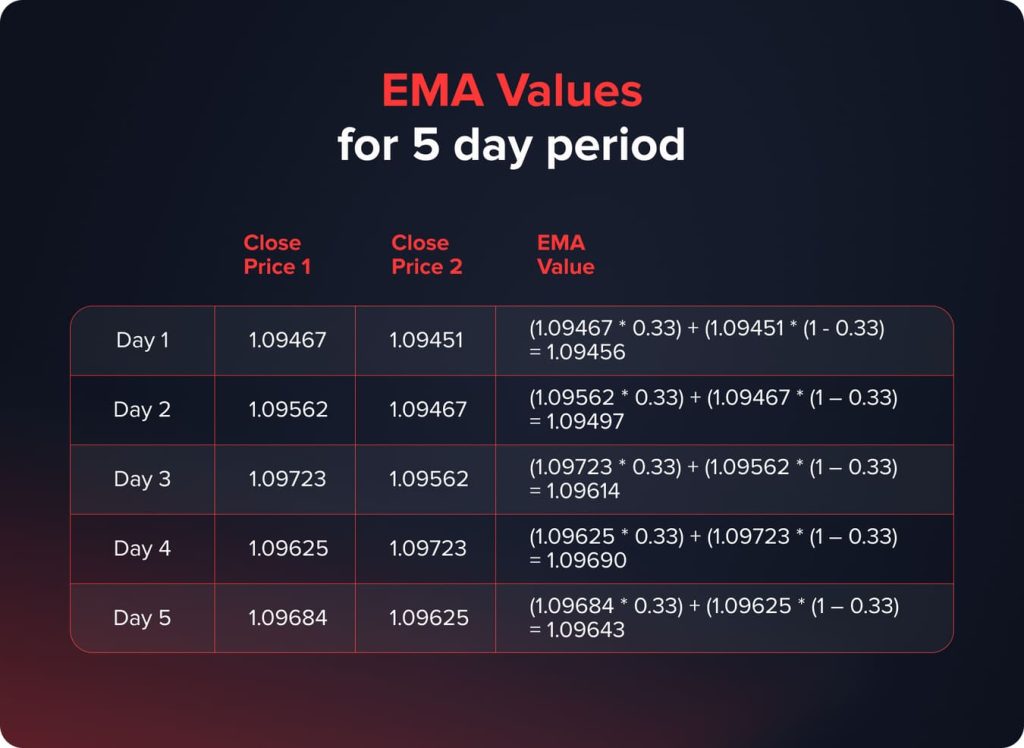
Los valores mencionados anteriormente son puntos a través de los cuales se construye la línea EMA.
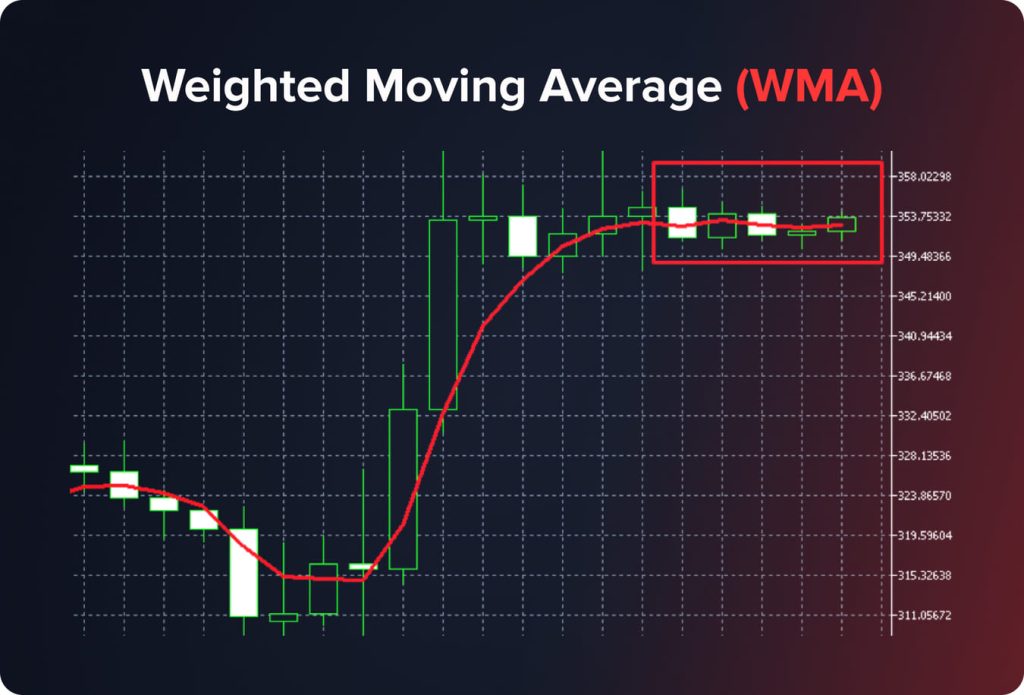
Promedio móvil ponderado (WMA)
La WMA otorga mayor valor a los períodos más recientes, pero no de forma exponencial como lo hace el indicador EMA. Este enfoque hace que la WMA no sea tan rápida, pero el instrumento sigue reaccionando rápidamente a los cambios de precio.
¿Qué es el indicador WMA?
Según el indicador WMA, el primer período tiene la menor ponderación, los períodos intermedios obtienen un valor medio y los últimos períodos son los más importantes y tienen el doble de ponderación en el cálculo. Para comprender mejor cómo funciona esta variación de la media móvil (MA), necesitamos descifrar la fórmula de la WMA.
¿Qué es la fórmula de la media móvil ponderada?
Al calcular WMA, cada período tiene su propio peso que depende directamente del número total de períodos.
Calcular el WMA implica un proceso de varios pasos que asigna pesos a diferentes puntos de datos según su orden cronológico. Por ejemplo, necesitamos activar un WMA de 5 días.
- Identifica el peso de cada período. El primer período tiene el menor peso (1) y el último, el mayor (5). La suma de todos los valores dentro de la WMA 5 es 15 (1 + 2 + 3 + 4 + 5).
- Calcular valores ponderados. Multiplicar los precios de cierre por sus ratios.

- Sume todos los valores ponderados para obtener la suma de los valores ponderados. La suma es igual a 352.714. Por lo tanto, obtuvimos la media móvil ponderada para los períodos p, del 9 al 13 de agosto.
¿Cómo utilizar el indicador WMA para predecir movimientos de precios futuros?
La media móvil ponderada es un indicador técnico versátil y fácil de usar, por lo que los operadores la incorporan frecuentemente a sus estrategias. A continuación, se presentan algunos ejemplos comunes de uso de este instrumento:
Filtrado de tendencias al analizar múltiples períodos de tiempo
Los traders profesionales analizan múltiples marcos temporales para comprender qué señales comerciales son verdaderas y cuáles son falsas.
- Identifique la dirección de una tendencia en el marco temporal H4 o D1. Luego, utilice el indicador WMA 200 para comprender la posición actual del precio del activo. Cuando el precio esté por encima de la línea WMA 200, busque únicamente señales de compra. Cuando el precio esté por debajo de la línea WMA 200, solo necesitará señales de venta.
- Cambie el marco temporal a la opción H1 y active los indicadores para encontrar señales de compra o venta.
- Abra una posición y coloque órdenes de stop-loss justo debajo del punto de oscilación más bajo (para una posición larga) o justo encima del punto de oscilación más alto (para una posición corta).
Uso de la media móvil ponderada como orden de stop-loss dinámica
Teniendo en cuenta que la WMA presta más atención a los precios a corto plazo, algunos operadores utilizan el indicador como stop loss en operaciones impulsivas. Por ejemplo, cuando una línea WMA 20 es superior a una WMA 100, los operadores pueden abrir posiciones largas esperando un movimiento alcista pronunciado. En lugar de establecer órdenes de toma de ganancias, los operadores siguen dinámicamente el mercado a través de la línea WMA 100, utilizándola como stop loss dinámico.
Cuando el precio de un activo alcanza el nivel de la WMA 100 y luego lo rompe, los operadores cierran una posición. La ventaja de esta estrategia es que, cuando la tendencia actual se mantiene en el mercado y el stop loss no se rompe, la WMA 100 superará el precio de entrada; lo que significa que el operador obtendrá ganancias.
Pros y contras del instrumento WMA
Estas son las principales ventajas del promedio móvil ponderado:
- La media móvil de corto plazo (WMA) es más sensible a las tendencias recientes. El indicador otorga mayor peso a los períodos más recientes, por lo que resulta excepcionalmente eficaz para las fluctuaciones de precios a corto plazo. Los operadores que prefieren estrategias de trading a corto plazo utilizan ampliamente diferentes WMA.
- Redireccionamiento oportuno de señales. El instrumento reacciona rápidamente a las actualizaciones de precios y proporciona a los operadores la información más precisa sobre los niveles de soporte y resistencia. Estos datos ayudan a los operadores a abrir o cerrar posiciones a tiempo, aumentando las ganancias o minimizando las pérdidas.
- Marcos temporales ajustables. La media móvil ponderada es igualmente efectiva en diversos marcos temporales, por lo que los operadores pueden adaptar fácilmente el instrumento a sus estilos y estrategias.
Al hablar de contras, se señalan los siguientes puntos débiles de la Media Móvil Ponderada:
- Alto nivel de ruido. A pesar de que la sensibilidad del WMA se menciona entre sus ventajas, genera ruidos altos y señales falsas. Los operadores deberían utilizar indicadores adicionales para obtener evidencia.
- Rezago ante movimientos rápidos de precios. A pesar de centrarse en los precios más recientes, las medias móviles de largo plazo (WMA) pueden seguir rezagadas ante movimientos de precios excepcionalmente rápidos. Como resultado, los operadores pierden ciertas oportunidades.
- Funcionalidad limitada en ciertos mercados. La eficiencia de la media móvil ponderada depende directamente de la volatilidad. En mercados volátiles, el instrumento pierde eficacia.
¿Qué es mejor, EMA o WMA?
Las medias móviles son ricas en variaciones; por lo tanto, los traders necesitan entender qué tipo de MA es la mejor solución.
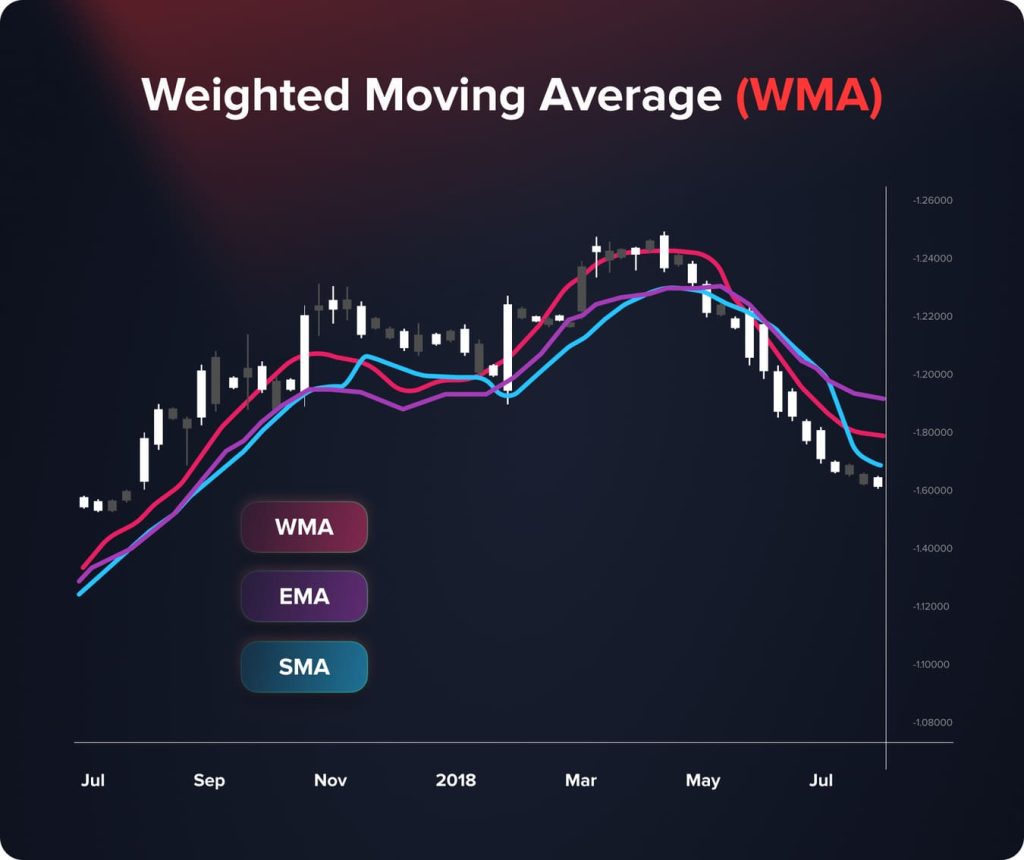
WMA vs. SMA
La principal diferencia entre las medias móviles simples (SMA) y las medias móviles de media móvil (WMA) reside en las peculiaridades de los sistemas de ponderación. La media móvil simple (SMA) iguala todos los niveles de precios, mientras que la WMA considera los precios más recientes como los más importantes.
Por lo tanto, las medias móviles simples (SMA) son más eficaces para identificar tendencias a largo plazo y abrir posiciones a largo plazo. La media móvil ponderada (MPP) es más sensible a las fluctuaciones de precios a corto plazo y es la mejor solución para los operadores que apuestan por estrategias a corto plazo.
WMA vs. EMA
Tanto las WMA como las EMA asignan ponderaciones diferentes a distintos precios y son más sensibles a las fluctuaciones recientes de precios. Si bien las WMA y las EMA tienen mucho en común, sus métodos de ponderación difieren. ¿Cuál de las dos variantes es mejor para un operador?
El indicador WMA presta mayor atención a los precios más recientes gracias al sistema de multiplicadores. Esto significa que, en tendencias fuertes, la línea WMA se acerca más al precio de un activo que las SMA y las EMA.
La WMA es más eficaz para predecir cambios de tendencia, ya que el indicador reacciona a los cambios de precios lo más rápido posible.
Al hablar de la eficiencia de cada variación de la media móvil, la elección debe depender del marco temporal, el estilo comercial y la estrategia comercial que prefiera.
En resumen
La media móvil ponderada (WMA) es un indicador técnico eficaz que ayuda a los operadores a identificar cambios de tendencia y reaccionar rápidamente ante ellos. Según la fórmula WMA, los niveles de precios recientes alcanzan el valor máximo; por ello, este indicador es especialmente útil para quienes trabajan con estrategias de trading a corto plazo.

