Volver
Contents
Média Móvel Ponderada Explicada: Definição e Exemplos


Iva Kalatozishvili
Business Development Manager

Demetris Makrides
Senior Business Development Manager
A Média Móvel Ponderada é um tipo de indicador de Média Móvel que atribui um valor a cada nível de preço. De acordo com o instrumento, os preços mais recentes obtêm um valor maior do que os iniciais e afetam mais o indicador.
Principais conclusões:
- Quais são os tipos do indicador Média Móvel?
- O que significa Média Móvel Ponderada (MMP)?
- O que é a fórmula da Média Móvel Ponderada?
- Como usar o instrumento WMA?
- Prós e contras do indicador WMA?
- Qual tipo de média móvel é melhor?
Média Móvel. Definição e Tipos do Instrumento
Os indicadores de Média Móvel estão entre os instrumentos mais utilizados para identificar uma tendência atual do mercado. Esses indicadores são igualmente úteis em diferentes períodos. Além disso, muitos instrumentos técnicos conhecidos, como o MACD e as Bandas de Bollinger, são baseados em Médias Móveis.
O principal objetivo do indicador Média Móvel é suavizar as flutuações de preços, reduzir os ruídos do mercado e capacitar os traders a identificar a tendência atual do mercado. Ao reduzir os ruídos de preço, os traders obtêm uma visão mais clara do que está acontecendo no mercado.
Existem muitos tipos de indicadores de Média Móvel, e os mais comuns são os seguintes: Média Móvel Simples (MMS), Média Móvel Exponencial e Média Móvel Ponderada (MMP). Vamos analisá-los em detalhes para entender as diferenças.
Média Móvel Simples (MMS)
A Média Móvel Simples atribui o mesmo valor a todos os níveis de preço. O indicador é baseado nos preços de fechamento.
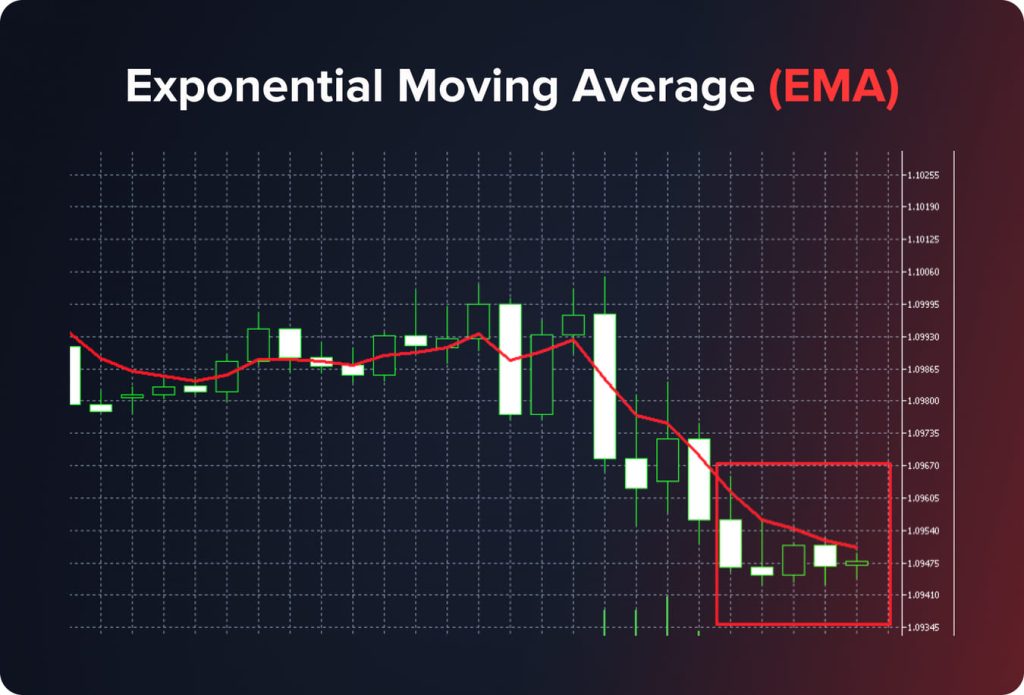
Por exemplo, um trader ativa uma MMS com um período de 5 dias. Vamos descobrir os cinco níveis de preço mais recentes (preços de fechamento) para cada período:
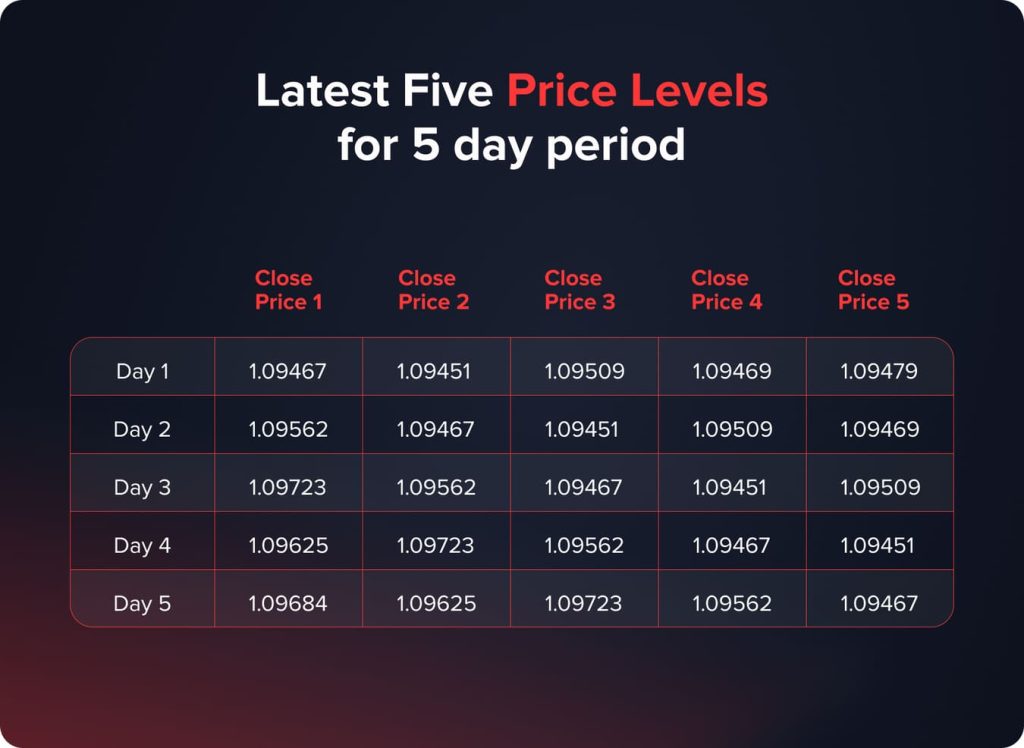
Em seguida, precisamos obter a média para cada período – somamos todos os valores de fechamento e dividimos pelos seus números (5). Como resultado, obtemos os seguintes valores: 1,09475, 1,09491, 1,09542, 1,09565, 1,09612.
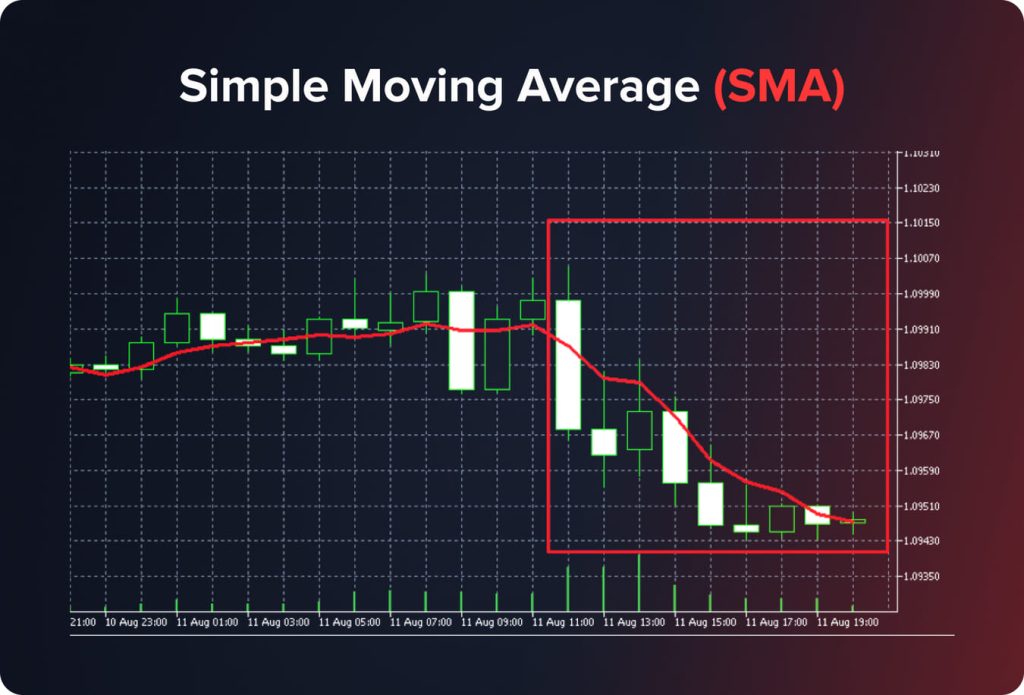
Os valores acima mencionados são pontos através dos quais a linha SMA é construída.
Média Móvel Exponencial (MME)
A Média Móvel Exponencial atribui mais valor aos preços mais recentes. Dessa forma, o indicador ajuda os traders a identificar mudanças de tendência mais rapidamente. A MME depende de um multiplicador específico (coeficiente). O multiplicador é usado para suavizar o indicador e dar mais peso aos períodos posteriores.
O multiplicador é calculado usando a seguinte fórmula:
M = (2 / (P + 1)
Nesta fórmula, M significa multiplicador e P é a designação do número de períodos.
Para uma EMA de 5 dias, o multiplicador é (2 / (5+1) = 0,33.
Além disso, precisamos levar em conta a fórmula da EMA, que se parece com:
EMA = (CP * M) + (CP-1 * (1 – M)
CP – preço de fechamento;
PC-1 – preço de fechamento do período anterior;
M – multiplicador.
Vamos calcular os valores da EMA para os dados fornecidos na tabela mencionada acima.
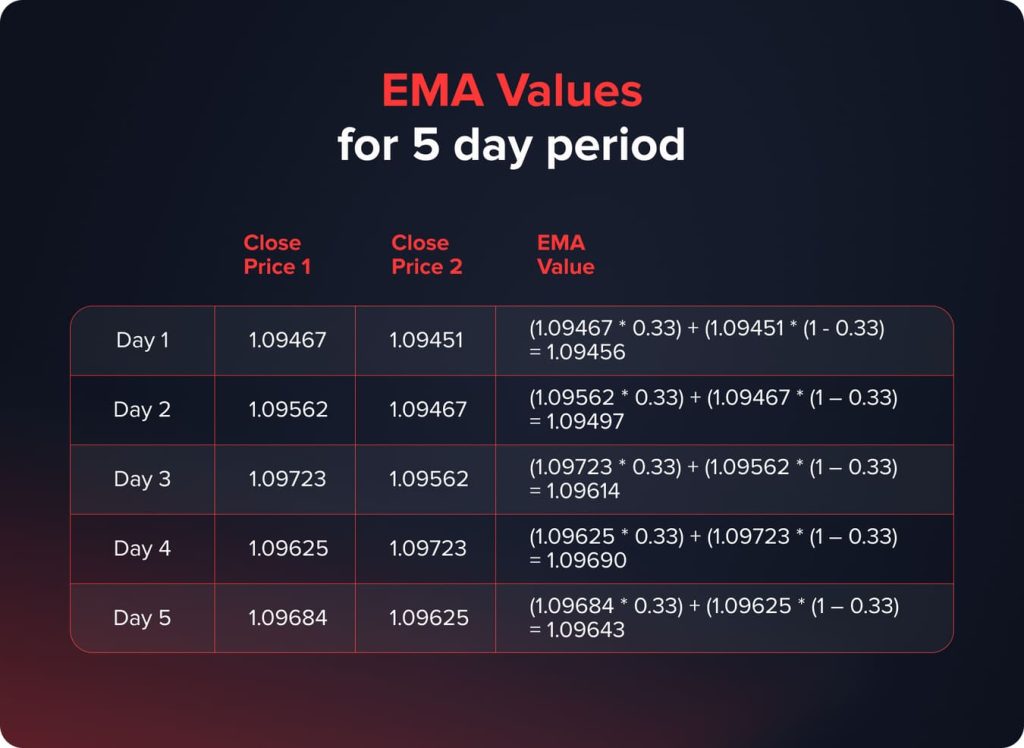
Os valores acima mencionados são pontos através dos quais a linha EMA é construída.
Média Móvel Ponderada (MMP)
A WMA valoriza mais os períodos mais recentes, mas não exponencialmente como o indicador EMA. Essa abordagem torna a WMA menos rápida, mas o instrumento ainda reage rapidamente às variações de preço.
O que é o Indicador WMA?
De acordo com o indicador WMA, o primeiro período recebe o menor peso, os períodos médios recebem valor médio e os períodos mais recentes são os mais importantes e recebem o dobro do peso no cálculo. Para entender melhor como essa variação da média móvel funciona, precisamos decodificar a fórmula da WMA.
O que é a fórmula da média móvel ponderada?
Ao calcular o WMA, cada período tem seu próprio peso, que depende diretamente do número total de períodos.
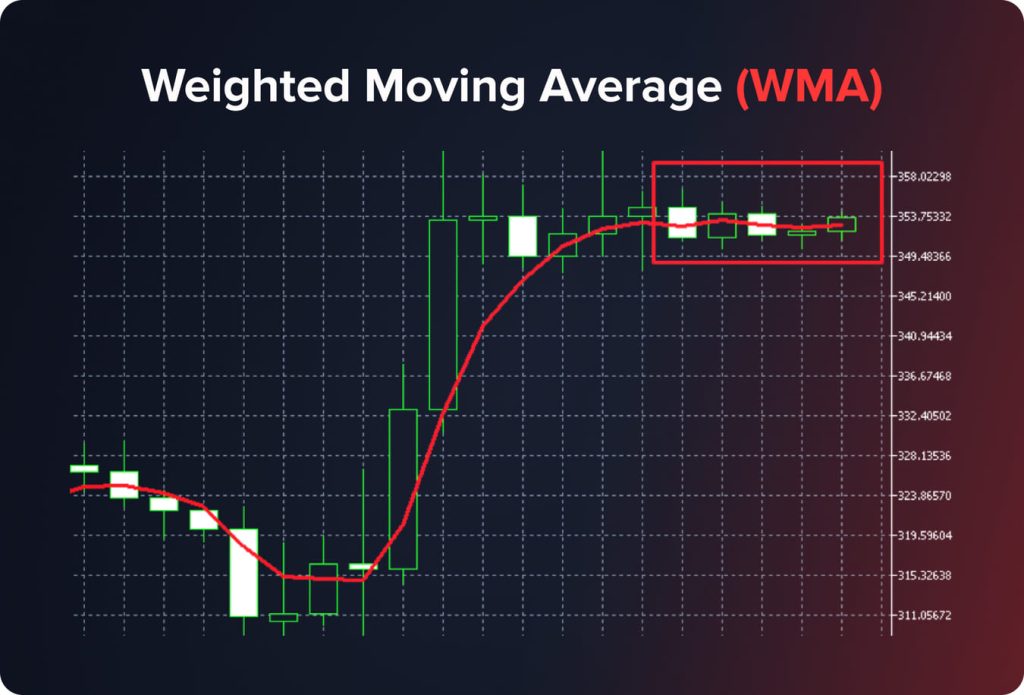
O cálculo do WMA envolve um processo de várias etapas que atribui pesos a diferentes pontos de dados com base em sua ordem cronológica. Por exemplo, precisamos ativar um WMA de 5 dias.
- Identifique o peso de cada período. O primeiro período recebe o menor peso (1), e o último período recebe o maior valor (5). A soma de todos os valores dentro da WMA 5 é 15 (1 + 2 + 3 + 4 + 5).
- Calcule os valores ponderados. Multiplique os preços de fechamento por suas proporções.

- Some todos os valores ponderados para obter a soma dos valores ponderados. A soma é igual a 352,714. Assim, obtivemos a Média Móvel Ponderada para os períodos p, de 9 a 13 de agosto.
Como usar o indicador WMA para prever movimentos futuros de preços?
A Média Móvel Ponderada é um indicador técnico versátil e fácil de usar; é por isso que os traders frequentemente a adicionam às suas estratégias. Aqui estão alguns casos comuns de uso do instrumento:
Filtrando tendências ao analisar vários períodos de tempo
Traders profissionais analisam múltiplos períodos para entender quais sinais de negociação são verdadeiros e quais são falsos.
- Identifique a direção da tendência no período H4 ou D1. Em seguida, utilize o indicador WMA 200 para entender em que posição o preço do ativo atual está. Quando o preço estiver acima da linha WMA 200, comece a procurar apenas sinais de compra. Quando o preço estiver abaixo da linha WMA 200, você precisará apenas de sinais de venda.
- Mude o período para a opção H1 e ative os indicadores para encontrar sinais de compra ou venda.
- Abra uma posição e coloque ordens de stop-loss logo abaixo do ponto de oscilação mais baixo (para uma posição longa) ou logo acima do ponto de oscilação mais alto (para uma posição curta).
Usando a média móvel ponderada como uma ordem de stop-loss dinâmica
Levando em consideração que a WMA dá mais atenção aos preços de curto prazo, alguns traders utilizam o indicador como um instrumento de stop-loss em operações de impulso. Por exemplo, quando uma linha da WMA 20 está acima de uma linha da WMA 100, os traders podem abrir posições compradas aguardando um movimento de alta acentuado. Em vez de definir ordens de take-profit, os traders acompanham dinamicamente o mercado através da linha da WMA 100, usando-a como um instrumento de stop-loss de trailing.
Quando o preço de um ativo atinge o nível da MMD 100 e, em seguida, o rompe, os traders fecham a posição. A vantagem dessa estratégia é que, quando a tendência atual se mantém no mercado e o nível de stop-loss não é rompido, a MMD 100 ultrapassará o preço de entrada; o que significa que o trader definitivamente obtém lucro.
Prós e contras do instrumento WMA
Aqui estão as principais vantagens da Média Móvel de Peso:
- A WMA é mais sensível às tendências recentes. O indicador dá mais peso aos períodos mais recentes, o que o torna excepcionalmente eficaz para movimentos de preços de curto prazo. Traders que preferem estratégias de negociação de curto prazo utilizam amplamente diferentes WMAs.
- Redirecionamentos de sinais oportunos. O instrumento reage rapidamente às atualizações de preço e fornece aos traders as informações mais precisas sobre os níveis de suporte e resistência. Esses dados ajudam os traders a entrar ou fechar posições em tempo hábil, aumentando os lucros ou minimizando as perdas.
- Prazos ajustáveis. A Média Móvel Ponderada é igualmente eficaz em diversos prazos; por isso, os traders podem facilmente adaptar o instrumento aos seus estilos e estratégias.
Ao falar sobre contras, os seguintes pontos fracos da Média Móvel Ponderada são apontados:
- Alto nível de ruído. Apesar da sensibilidade do WMA ser mencionada entre as vantagens, ela gera altos níveis de ruído e sinais falsos. Os traders devem utilizar alguns indicadores adicionais para obter alguma comprovação.
- Atraso em relação a movimentos de preços rápidos. Apesar do foco nos preços mais recentes, as MMAs ainda podem apresentar atraso em relação a movimentos de preços excepcionalmente rápidos. Como resultado, os traders perdem certas oportunidades.
- Funcionalidade limitada em determinados mercados. A eficiência da Média Móvel Ponderada depende diretamente da volatilidade. Em mercados voláteis, o instrumento se torna menos eficaz.
Qual é melhor, EMA ou WMA?
As médias móveis são ricas em variações; portanto, os traders precisam entender qual tipo de MM é a melhor solução.
WMA vs SMA
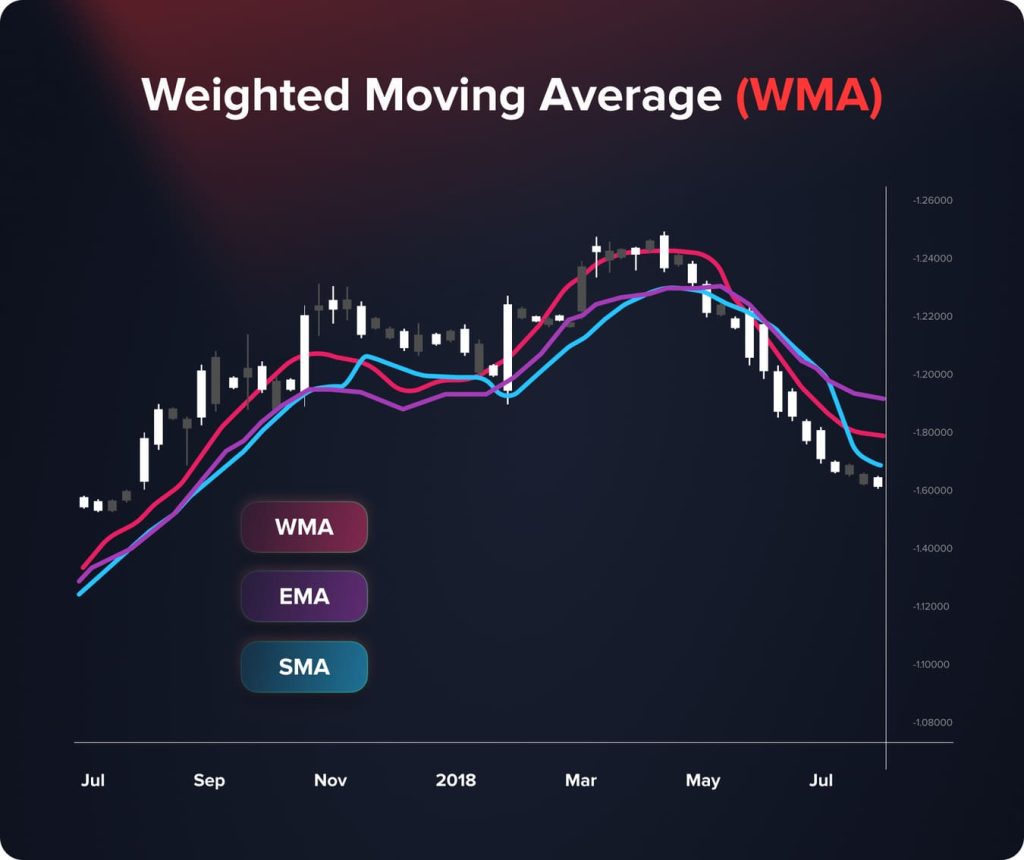
A principal diferença entre Médias Móveis Simples (MMS) e Médias Móveis de Longo Prazo (MMW) reside nas peculiaridades dos sistemas de ponderação. A Média Móvel Simples (MMS) equaliza todos os níveis de preços, enquanto a MMD considera os preços mais recentes como os mais importantes.
Dessa forma, as Médias Móveis Médias (MMS) são mais eficazes para identificar tendências de longo prazo e abrir posições de longo prazo. A Média Móvel Ponderada (MMP) é mais sensível a movimentos de preços de curto prazo e é a melhor solução para traders que apostam em estratégias de curto prazo.
WMA vs EMA
Tanto as WMAs quanto as EMAs definem pesos diferentes para preços diferentes e são mais sensíveis às variações recentes de preço. Apesar de as WMAs e as EMAs terem muito em comum, suas abordagens de ponderação ainda são diferentes. Qual variação é melhor para um trader?
O indicador WMA presta mais atenção aos preços mais recentes devido ao sistema de multiplicadores. Isso significa que, em tendências fortes, a linha WMA está mais próxima do preço de um ativo em comparação com SMAs e EMAs.
O WMA é mais eficaz na previsão de mudanças de tendência, pois o indicador reage às mudanças de preço o mais rápido possível.
Ao falar sobre a eficiência de cada variação da Média Móvel, a escolha deve depender do período de tempo, estilo de negociação e estratégia de negociação que você preferir.
Conclusão
A Média Móvel Ponderada é um indicador técnico eficaz que ajuda os traders a identificar mudanças de tendência e reagir rapidamente a elas. De acordo com a fórmula da Média Móvel Ponderada (MMP), os níveis de preço recentes obtêm o maior valor; por isso, esse indicador é especialmente útil para traders que trabalham com estratégias de negociação de curto prazo.
FAQ
A eficácia do indicador WMA depende diretamente das condições de negociação. O instrumento é mais eficaz para negociações de curto prazo, pois reage rapidamente às variações de preço.
De acordo com a WMA, os períodos mais antigos recebem os valores mais baixos, enquanto os mais recentes recebem os valores mais altos. O peso é calculado com a ajuda de multiplicadores.
A Média Móvel Ponderada está entre os instrumentos padrão adicionados por padrão à grande maioria dos terminais de negociação. Isso basta para ativar o indicador de Média Móvel e, em seguida, alterar seu tipo para "Ponderada". Personalize o período com base na sua estratégia de negociação.
Actualizado:
19 de diciembre de 2024

