ตัวบ่งชี้ตลาดและประเภท: วิธีใช้
เนื้อหา
ตัวบ่งชี้ตลาดคืออะไร?
ตัวบ่งชี้ตลาดถูกนิยามให้ดีที่สุดว่าเป็นเครื่องมือเชิงปริมาณที่นักลงทุนหรือเทรดเดอร์ใช้เพื่อประเมินแนวโน้มการเคลื่อนไหวของตลาดในอนาคต โดยพื้นฐานแล้ว ตัวบ่งชี้ตลาดจะประกอบด้วยการวิเคราะห์ทางเทคนิคบางส่วนที่แตกต่างจากแบบเดิมเพียงวิธีการรวบรวมข้อมูลจากหลักทรัพย์ต่างๆ
สิ่งเหล่านี้ช่วยสะท้อนภาพรวมของภาวะตลาดและแนวโน้มของตลาด ไม่ใช่แค่บริษัทหรือสินทรัพย์เท่านั้น การติดตามตัวชี้วัดสำคัญๆ ของตลาด เช่น ความกว้าง ความเชื่อมั่น และปริมาณการซื้อขาย ช่วยให้เข้าใจสภาพแวดล้อมของตลาดปัจจุบันได้ดียิ่งขึ้น ส่งผลให้สามารถตัดสินใจซื้อขายและลงทุนได้อย่างชาญฉลาดยิ่งขึ้น
ต่างจากกราฟราคาแบบง่ายๆ ตัวบ่งชี้ตลาดช่วยให้คุณเข้าใจความหมายจากข้อมูลทางการเงินมากมายมหาศาลนี้ได้มากขึ้น ตัวบ่งชี้เหล่านี้มีประโยชน์อย่างมากในการติดตามแนวโน้มที่เกิดขึ้นใหม่ มองหาจุดกลับตัวที่อาจเกิดขึ้น และประเมินจุดแข็งหรือจุดอ่อนของการเคลื่อนไหวของตลาด ดังนั้น ทักษะหนึ่งที่นักลงทุนหรือเทรดเดอร์ที่จริงจังควรฝึกฝนคือ การอ่านและตีความตัวบ่งชี้
ประเภทของตัวบ่งชี้ตลาด
ตัวบ่งชี้ความกว้างของตลาด
ตัวบ่งชี้เหล่านี้คือตัวชี้วัดที่วัดความสมดุลระหว่างหุ้นที่ปรับตัวขึ้นและหุ้นที่ปรับตัวลดลงในดัชนีหรือตลาด ตัวชี้วัดเหล่านี้จะถูกนำไปใช้เพื่อประเมินการมีส่วนร่วมและความแข็งแกร่งของการเคลื่อนไหวของตลาด แทนที่จะใช้เพียงการสังเกตผลการดำเนินงานของหุ้นที่มีน้ำหนักมากที่สุดหรือมีน้ำหนักมากที่สุดเท่านั้น
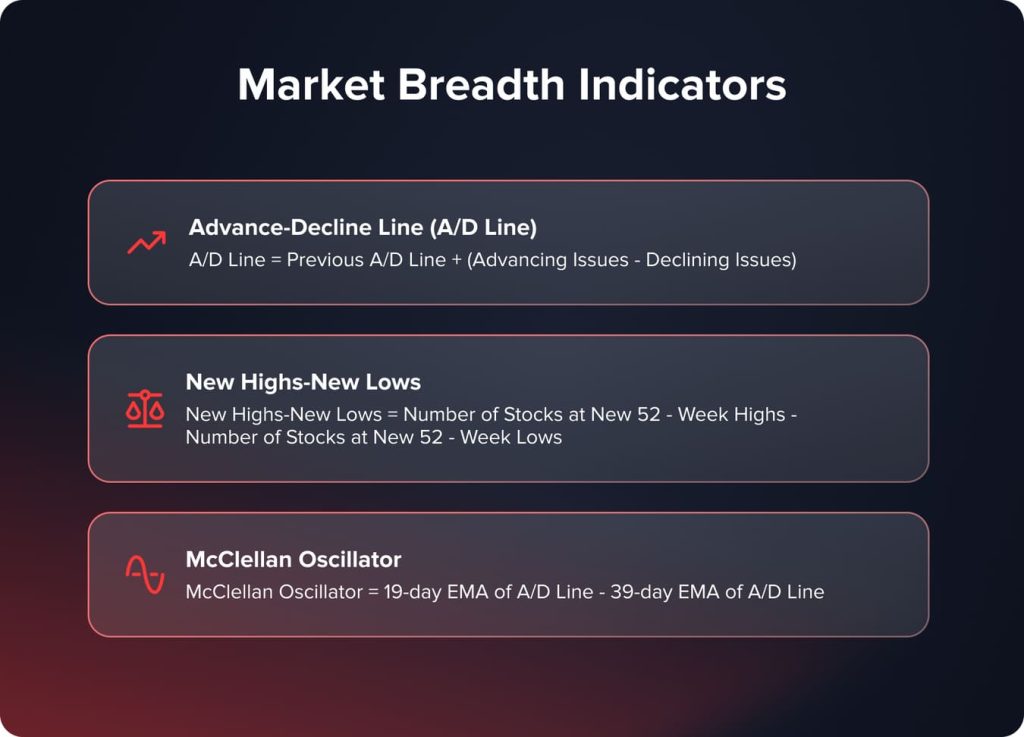
เส้นล่วงหน้า-ลดลง (เส้น A/D)
เส้นแสดงสถานะล่วงหน้า-ลดลง คือ ผลต่างสะสมของจำนวนหุ้นที่ซื้อขายล่วงหน้าและลดลงในแต่ละวันซื้อขาย โดยจะเพิ่มขึ้นเมื่อมีหุ้นที่ซื้อขายล่วงหน้ามากกว่าหุ้นที่ซื้อขายล่วงหน้า หรือจะลดลงหากมีหุ้นที่ซื้อขายล่วงหน้ามากกว่า
เส้น A/D ยืนยันทิศทางของแนวโน้มตลาดโดยรวม เส้น A/D ที่พุ่งขึ้นแสดงถึงหุ้นจำนวนมากที่เข้าร่วมในแนวโน้มขาขึ้น ขณะที่เส้น A/D ที่ลดลงแสดงถึงความกว้างของตลาดที่ลดลง และมีแนวโน้มว่าจะเป็นสัญญาณการกลับตัวของแนวโน้ม ความแตกต่างระหว่างเส้น A/D และดัชนีอ้างอิงก็อาจเป็นสัญญาณสำคัญเช่นกัน
ในการหาเส้น A/D ให้ลบจำนวนหุ้นที่ลดลงออกจากจำนวนหุ้นที่เติบโตในแต่ละวัน แล้วบวกผลลัพธ์สะสมดังนี้:
เส้น A/D = เส้น A/D ก่อนหน้า + (จำนวนหุ้นที่เพิ่ม - จำนวนหุ้นที่ลดลง)
ข้อมูลเส้น A/D สำหรับดัชนีหลักของสหรัฐฯ เช่น S&P 500 และ Nasdaq Composite มีอยู่ในเว็บไซต์ทางการเงินและผู้จำหน่ายข้อมูล
จุดสูงใหม่-จุดต่ำใหม่
ดัชนี New Highs-New Lows เป็นอีกหนึ่งตัวชี้วัดเชิงกว้างที่นับจำนวนหุ้นที่ทำราคาสูงสุดใหม่ในรอบ 52 สัปดาห์ เทียบกับหุ้นที่ทำราคาต่ำสุดใหม่ในรอบ 52 สัปดาห์ในวันทำการใดๆ เมื่อราคาสูงสุดใหม่สูงกว่าราคาต่ำสุดใหม่ แสดงให้เห็นถึงการมีส่วนร่วมของตลาดในวงกว้างและความแข็งแกร่ง เช่นเดียวกัน เมื่อราคาต่ำสุดใหม่เพิ่มขึ้นเร็วกว่าราคาสูงสุดใหม่ แสดงให้เห็นถึงความเป็นไปได้ที่เพิ่มขึ้นของตลาดที่อ่อนแอ
ในการคำนวณเส้นจุดสูงสุดใหม่-จุดต่ำสุดใหม่:
จุดสูงใหม่-จุดต่ำใหม่ = จำนวนหุ้นที่จุดสูงใหม่ในรอบ 52 สัปดาห์ - จำนวนหุ้นที่จุดต่ำใหม่ในรอบ 52 สัปดาห์
เช่นเดียวกับเส้น A/D ตัวบ่งชี้นี้มักถูกแสดงร่วมกับดัชนีตลาดหลักเพื่อค้นหาความแตกต่างและยืนยันแนวโน้มโดยรวม
ออสซิลเลเตอร์แมคเคลแลน
McClellan Oscillator เป็นตัววัดความกว้างของตลาดที่ซับซ้อนกว่าซึ่งช่วยปรับความผันผวนในข้อมูล Advance-Decline ให้ราบรื่นขึ้นโดยการนำความแตกต่างระหว่างค่าเฉลี่ยเคลื่อนที่แบบเลขชี้กำลังสองค่าที่ต่างกันของ Advance-Decline Line มาใช้
สูตรของ McClellan Oscillator คือ:
McClellan Oscillator = EMA 19 วันของเส้น A/D - EMA 39 วันของเส้น A/D
โดยปกติแล้วออสซิลเลเตอร์ที่ได้จะมีช่วงตั้งแต่ -150 ถึง +150 โดยค่าบวกแสดงถึงแนวโน้มขาขึ้น และในทางกลับกัน ความแตกต่างระหว่าง McClellan Oscillator กับภาพรวมตลาดก็อาจเป็นสัญญาณเตือนภัยได้เช่นกัน
ตัวบ่งชี้ความเชื่อมั่นของตลาด
ในขณะที่ตัวบ่งชี้ความกว้างของตลาดมีไว้สำหรับการมีส่วนร่วมและโมเมนตัมในการเคลื่อนไหวของตลาด ตัวบ่งชี้ความเชื่อมั่นจะพยายามหาข้อมูลที่เกี่ยวข้องกับจิตวิทยาทั่วไปและตำแหน่งของนักลงทุน ตัวบ่งชี้เหล่านี้อาจใช้เพื่อแสดงให้เห็นว่าตลาดมีภาวะซื้อมากเกินไปหรือตลาดมีแนวโน้มขาขึ้นมากเกินไป หรือในทางกลับกัน หากตลาดเหล่านี้กำลังกลายเป็นตลาดขายมากเกินไปหรือตลาดขาลงมากเกินไป

อัตราส่วนการซื้อ-ขาย
อัตราส่วน Put-Call อาจเป็นตัวชี้วัดความเชื่อมั่นของตลาดที่ถูกจับตามองมากที่สุด สะท้อนถึงปริมาณการซื้อขายออปชัน Put เทียบกับออปชัน Call จึงสะท้อนถึงระดับความกลัวและความโลภของนักลงทุน
อัตราส่วน Put-Call ที่สูง ซึ่งปริมาณ Put มากกว่า Call สะท้อนถึงแนวโน้มขาลงมากกว่า เพราะนั่นหมายความว่านักลงทุนกำลังถือสถานะ Put เพื่อป้องกันความเสี่ยง ในทางกลับกัน อัตราส่วน Put-Call ที่ต่ำ หมายความว่าการซื้อ Call จะสูงกว่าการซื้อ Put
อัตราส่วน Put-Call ถูกกำหนดดังนี้:
อัตราส่วน Put-Call = ปริมาณ Put ทั้งหมด / ปริมาณ Call ทั้งหมด
โดยปกติแล้วอัตราส่วน Put-Call ที่สูงกว่า 1.0 ถือเป็นขาลง และต่ำกว่า 0.85 อาจถือเป็นขาขึ้น การวิเคราะห์ที่สำคัญอีกประการหนึ่งคือความแตกต่างระหว่างอัตราส่วน Put-Call กับภาวะตลาดโดยรวม
อัตราส่วนกระทิง/หมี
อัตราส่วน Bull/Bear มีแนวคิดคล้ายคลึงกับอัตราส่วน Put-Call ตรงที่พยายามวัดความเชื่อมั่นของนักลงทุนโดยตรงผ่านการสำรวจ บริษัทวิจัยการลงทุนแห่งหนึ่ง เช่น สมาคมนักลงทุนรายย่อยแห่งอเมริกา (American Association of Individual Investors) จัดทำแบบสำรวจรายสัปดาห์เป็นประจำ โดยถามว่าสัดส่วนใดที่ตลาดมีแนวโน้มขาขึ้น เมื่อเทียบกับสัดส่วนใดที่ตลาดมีแนวโน้มขาลง
อัตราส่วนกระทิง/หมีที่สูงจะบ่งชี้ถึงสถานการณ์ที่สัดส่วนของนักลงทุนที่มองว่าตลาดเป็นขาขึ้นมีจำนวนมากเมื่อเทียบกับสัดส่วนของนักลงทุนที่มองว่าตลาดเป็นขาลง และอาจบ่งชี้ถึงการมองโลกในแง่ดีเกินไป ซึ่งทำให้ตลาดมีความเสี่ยง หากอัตราส่วนนี้ต่ำ แสดงว่านักลงทุนที่มองว่าตลาดเป็นขาลงมีมากกว่านักลงทุนที่มองว่าตลาดเป็นขาขึ้น ซึ่งหมายความว่าตลาดมีมุมมองเชิงลบอย่างมาก และควรมีการเปลี่ยนแปลงแนวโน้ม
อัตราส่วนกระทิง/หมีสามารถคำนวณได้ดังนี้:
อัตราส่วนกระทิง/หมี = เปอร์เซ็นต์กระทิง / เปอร์เซ็นต์หมี
โดยปกติแล้วค่าที่อ่านได้มากกว่า 1.0 ถือว่าเป็นแนวโน้มขาขึ้น ในขณะที่ค่าที่อ่านได้ต่ำกว่า 1.0 ถือว่าเป็นแนวโน้มขาลง
ดัชนีความผันผวน (VIX)
ดัชนีความผันผวน (Volatility Index) เป็นตัวชี้วัดที่สะท้อนถึงความเชื่อมั่นของตลาดเกี่ยวกับระดับความผันผวนที่คาดการณ์ไว้ในช่วง 30 วันข้างหน้าของออปชันในดัชนี S&P 500 ดัชนีนี้สะท้อนถึงมุมมองที่นักลงทุนรับรู้เกี่ยวกับสถานการณ์ของตลาดในช่วงเวลาต่อๆ ไป โดยเฉพาะอย่างยิ่งเมื่อพิจารณาจากพฤติกรรมความเสี่ยงด้านตลาดของพวกเขา
ในทางกลับกัน การที่ดัชนี VIX พุ่งสูงขึ้นอาจบ่งชี้ว่านี่คือจุดสูงสุดของตลาดที่นักลงทุนกำลังขาย และถึงเวลาเข้าซื้อแล้ว เนื่องจากนักลงทุนมีความกังวลอย่างมาก ในทางกลับกัน ระดับ VIX ที่ต่ำอาจบ่งชี้ถึงความประมาทและสภาวะตลาดที่ซื้อมากเกินไป
VIX คือการคำนวณแบบเรียลไทม์ของตลาด Chicago Board Options Exchange โดยอ้างอิงจากราคาของออปชันดัชนี S&P 500 โดยปกติ VIX จะอยู่ระหว่างระดับ 10 ในช่วงเวลาที่ตลาดผันผวน และสูงกว่า 30 ในช่วงเวลาที่ตลาดผันผวนมาก
ค่าเฉลี่ยเคลื่อนที่
ค่าเฉลี่ยเคลื่อนที่ เป็นส่วนสำคัญของการวิเคราะห์ทางเทคนิค และยังสามารถใช้เป็นตัวบ่งชี้ตลาดที่มีประสิทธิภาพได้อีกด้วย ตัวชี้วัดเหล่านี้จะช่วยปรับความผันผวนของราคาดัชนีหรือสินทรัพย์ในแต่ละวันให้ราบรื่นขึ้น ช่วยให้คุณระบุทิศทางและโมเมนตัมของแนวโน้มพื้นฐานได้
ค่าเฉลี่ยเคลื่อนที่แบบง่าย (SMA)
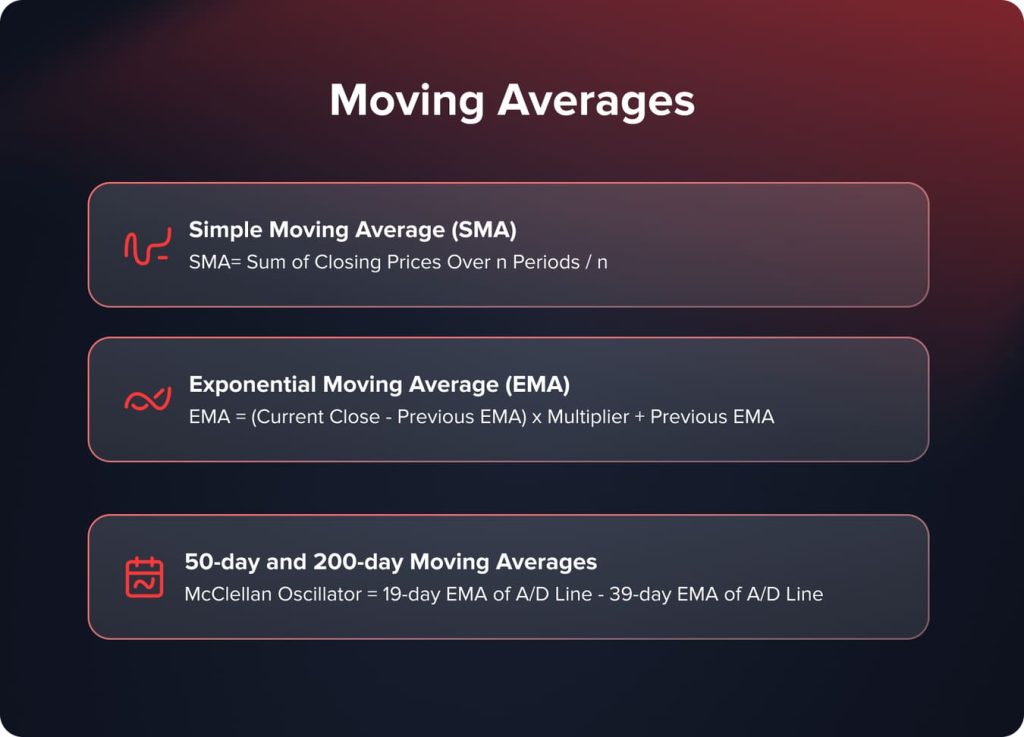
SMA เป็นค่าเฉลี่ยเคลื่อนที่ที่ตรงไปตรงมามากที่สุด โดยคำนวณโดยใช้ค่าเฉลี่ยของราคาปิดของตราสารในกรอบเวลาที่กำหนดจำนวนหนึ่ง
สูตรที่ใช้ในการคำนวณค่าเฉลี่ยเคลื่อนที่แบบง่ายมีดังนี้
SMA = ผลรวมของราคาปิดในช่วง n ช่วงเวลา / n
เส้น SMA จะมีประโยชน์ในการกำหนดทิศทางแนวโน้มโดยรวม และยังช่วยแสดงแนวรับและแนวต้าน โดยทั่วไปแล้ว เส้น SMA ที่เพิ่มขึ้นจะยืนยันแนวโน้มขาขึ้น ในขณะที่เส้น SMA ลงจะส่งสัญญาณแนวโน้มขาลง นอกจากนี้ สัญญาณการซื้อขายยังอาจเกิดขึ้นจากการตัดกันระหว่างเส้น SMA ระยะสั้นและระยะยาว
ค่าเฉลี่ยเคลื่อนที่แบบเอ็กซ์โพเนนเชียล (EMA)
วิธีนี้ให้ความสำคัญกับข้อมูลล่าสุด หรือที่เรียกว่าค่าเฉลี่ยเคลื่อนที่แบบเอ็กซ์โพเนนเชียล (Exponential Moving Average) มากกว่า ซึ่งทำให้ค่าเฉลี่ยเคลื่อนที่นี้ตอบสนองต่อการเปลี่ยนแปลงของราคาล่าสุดได้ดีมาก ดังนั้นจึงเป็นเครื่องมือหลักในการวัดการเปลี่ยนแปลงของโมเมนตัมระยะสั้น
ค่าเฉลี่ยเคลื่อนที่แบบเอ็กซ์โพเนนเชียลจะถูกคำนวณดังนี้:
EMA = (ราคาปิดปัจจุบัน - EMA ก่อนหน้า) x ตัวคูณ + EMA ก่อนหน้า
โดยที่ตัวคูณ = 2 / (ช่วงเวลา + 1)
เป็นพื้นฐานของตัวบ่งชี้ส่วนใหญ่ในการให้สัญญาณซื้อและขาย เช่น ตัวบ่งชี้ที่ให้สัญญาณโดยออสซิลเลเตอร์ MACD
ค่าเฉลี่ยเคลื่อนที่ 50 วันและ 200 วัน
เส้นค่าเฉลี่ยเคลื่อนที่แบบง่าย (SMA) 50 วันและ 200 วัน เป็นค่าเฉลี่ยเคลื่อนที่หลักสองค่าที่คนส่วนใหญ่รู้จัก เส้นค่าเฉลี่ยเคลื่อนที่ 50 วันสะท้อนถึงสัญญาณในระยะกลาง ขณะที่เส้นค่าเฉลี่ยเคลื่อนที่ 200 วันเป็นตัวกำหนดแนวโน้มระยะยาว ค่าเฉลี่ยเคลื่อนที่ระยะยาวเหล่านี้ได้รับการตรวจสอบอย่างใกล้ชิดโดยเทรดเดอร์ นักลงทุน และนักวิเคราะห์ตลาด เพื่อประเมินภาวะตลาดและทิศทางของภาพรวมตลาด
ปริมาตรสมดุล (OBV)
OBV เป็นอีกหนึ่งตัวบ่งชี้ตลาดที่ติดตามการเคลื่อนไหวของปริมาณการซื้อขาย และบันทึกโมเมนตัมของตลาด ซึ่งแตกต่างจากราคา OBV จะเน้นเฉพาะข้อมูลที่เกี่ยวข้องกับปริมาณการซื้อขายเท่านั้น
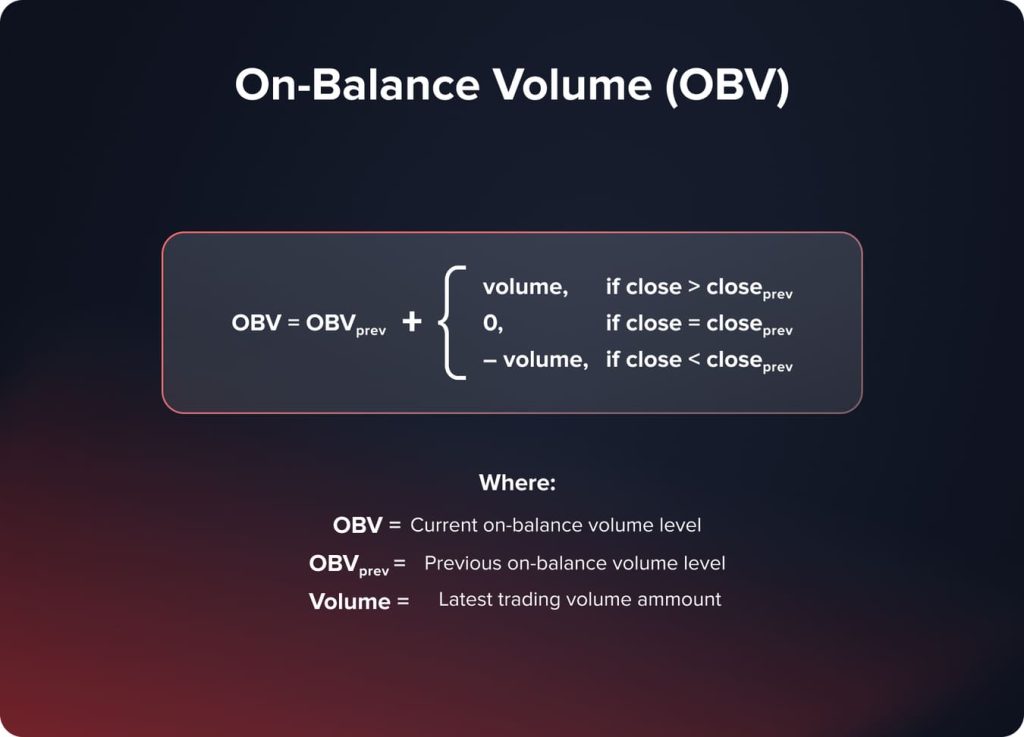
สูตรคำนวณค่า OBV
OBV = OBV ก่อนหน้า + ปริมาณปัจจุบัน ถ้าปิด > ปิดก่อนหน้า
Prev OBV - ปริมาณปัจจุบัน ถ้าปิด< Prev ปิดแล้ว
Prev OBV-if close = Prev close
OBV จะเพิ่มขึ้นเมื่อปริมาณการซื้อขายสัมพันธ์กับราคาปิดที่สูงกว่าราคาปิดก่อนหน้า และจะลดลงเมื่อปริมาณการซื้อขายสัมพันธ์กับราคาปิดที่ต่ำกว่า ด้วยวิธีนี้ ตัวบ่งชี้สามารถแสดงแรงกดดันด้านปริมาณการซื้อขายเชิงบวกหรือเชิงลบที่ส่งผลต่อตลาดได้
ในทางกลับกัน แนวโน้มขาขึ้นจะได้รับการยืนยันเมื่อเส้น OBV กำลังเพิ่มขึ้น นั่นคือปริมาณการซื้อขายไหลเข้าสู่ตลาด เส้น OBV ที่ลดลงบ่งชี้ถึงแนวโน้มขาลงที่อาจเกิดขึ้น เนื่องจากปริมาณการขายเริ่มแซงหน้าปริมาณการซื้อ ความแตกต่างระหว่าง OBV และการเคลื่อนไหวของราคาอ้างอิงอาจเป็นสัญญาณเตือนที่สำคัญได้เช่นกัน
วิธีการเลือกตัวบ่งชี้ตลาดที่เหมาะสม
กลยุทธ์การซื้อขายและกรอบเวลา
ตัวบ่งชี้บางตัวอาจเหมาะสมกว่าเมื่อพิจารณาจากกรอบเวลาและวิธีการซื้อขายของคุณ นักลงทุนระยะสั้นอาจให้ความสำคัญกับตัวบ่งชี้โมเมนตัมและตัวชี้วัดความผันผวนมากกว่า ในขณะที่นักลงทุนระยะยาวจะให้ความสำคัญกับตัวบ่งชี้การติดตามแนวโน้มและตัวบ่งชี้ความกว้างของตลาดมากกว่า
ตัวอย่างเช่น เดย์เทรดเดอร์ที่ต้องการใช้ประโยชน์จากการแกว่งตัวระหว่างวันจะได้รับประโยชน์จาก McClellan Oscillator หรือ VIX มากกว่านักลงทุนที่ถือครองสถานะซื้อโดยใช้ค่าเฉลี่ยเคลื่อนที่ 200 วัน
สภาวะตลาด
ชุดตัวบ่งชี้ที่ดีที่สุดย่อมเปลี่ยนแปลงไปตามสภาวะตลาด สำหรับตลาดขาขึ้น ตัวบ่งชี้โมเมนตัมอย่าง MACD อาจมีประโยชน์มากกว่าในการบ่งชี้ว่าเมื่อใดที่ราคาหุ้นเข้าสู่ระดับซื้อมากเกินไป และเมื่อใดที่คาดว่าจะเกิดการย่อตัว อย่างไรก็ตาม ในตลาดที่ผันผวนและอยู่ในกรอบแคบ ตัวบ่งชี้ความผันผวน เช่น Average True Range (ATR) อาจแสดงข้อมูลที่เกี่ยวข้องได้มากกว่า
ความสำเร็จต้องอาศัยการใส่ใจต่อสภาพแวดล้อมตลาดที่กว้างขึ้นและความเต็มใจที่จะเปลี่ยนแปลงไปพร้อมกับมันโดยปรับชุดเครื่องมือตัวบ่งชี้ของคุณให้เหมาะสม
การยอมรับความเสี่ยง
โปรไฟล์ความเสี่ยงส่วนบุคคลและรูปแบบการซื้อขายของคุณควรมีผลต่อตัวชี้วัดที่คุณเลือกใช้ นักลงทุนที่อนุรักษ์นิยมมักจะใช้การวัดความกว้างของตลาดและความเชื่อมั่นของตลาด เนื่องจากสิ่งเหล่านี้ให้มุมมองภาพรวม ในขณะที่โมเมนตัมออสซิลเลเตอร์น่าจะน่าสนใจสำหรับเทรดเดอร์ที่ก้าวร้าวมากกว่า
ประเด็นสำคัญก็คือตัวบ่งชี้ที่ "ดีที่สุด" คือตัวบ่งชี้ที่ทำงานภายในแนวทางการซื้อขายโดยรวมและกรอบการจัดการความเสี่ยงของคุณ
You may also like

การรวมตัวบ่งชี้หลายตัว
แม้ว่าการไม่จมอยู่กับข้อมูลมากเกินไปจะเป็นสิ่งสำคัญ แต่การใช้ชุดตัวบ่งชี้ตลาดที่เสริมกันอย่างรอบคอบจะช่วยให้การวิเคราะห์มีหลักฐานยืนยันที่ดีขึ้น เคล็ดลับอยู่ที่การหาจุดยืนยันและจุดแตกต่างโดยใช้ตัวชี้วัดหลายตัวเพื่อยืนยันสัญญาณการซื้อขายของคุณ
โดยเฉพาะอย่างยิ่ง คุณสามารถรวมเส้น A/D เข้ากับอัตราส่วน Put-Call เพื่อประเมินสุขภาพโดยรวมของตลาด รวมค่าเฉลี่ยเคลื่อนที่ 50 วันและ 200 วันเพื่อกำหนดทิศทางของแนวโน้ม และอื่นๆ
การทดสอบย้อนหลังและการเพิ่มประสิทธิภาพ
เมื่อได้ระบุชุดตัวบ่งชี้ตลาดหลักที่คุณจะติดตามแล้ว ขั้นตอนต่อไปคือการทดสอบประสิทธิภาพย้อนหลัง เพื่อดูว่าตัวบ่งชี้เหล่านั้นให้สัญญาณที่สอดคล้องกันและมีความหมายต่อกลยุทธ์การซื้อขายของคุณหรือไม่ นอกจากนี้ อาจจำเป็นต้องลองใช้พารามิเตอร์และอินพุตต่างๆ สำหรับตัวบ่งชี้ต่างๆ เพื่อเพิ่มประสิทธิภาพการทำนาย
เครื่องมือต่างๆ เช่น การค้นหาแบบกริดและอัลกอริทึมเชิงพันธุกรรม สามารถช่วยกำหนดการตั้งค่าตัวบ่งชี้ "ที่ดีที่สุด" ให้กับสภาพแวดล้อมและกรอบเวลาเฉพาะของคุณได้อย่างเป็นระบบ กล่าวอีกนัยหนึ่ง กุญแจสำคัญในการรักษาความได้เปรียบในตลาดคือการทดสอบย้อนหลังและปรับแต่งการใช้งานตัวบ่งชี้อย่างต่อเนื่อง
ข้อผิดพลาดและอุปสรรคทั่วไปในการใช้ตัวบ่งชี้ตลาด
การพึ่งพาตัวบ่งชี้ตัวใดตัวหนึ่งมากเกินไป
การพึ่งพาตัวชี้วัดตลาดใดตัวชี้วัดหนึ่งมากเกินไปจะทำให้เกิดจุดบอดและทำให้การวิเคราะห์มีความลำเอียง เนื่องจากตัวชี้วัดทุกตัวมีจุดแข็งและข้อจำกัดของตัวเอง การใช้ตัวชี้วัดที่หลากหลายจึงเป็นสิ่งสำคัญเสมอ เพื่อให้มองเห็นภาพรวมของตลาดได้ชัดเจนยิ่งขึ้น
การตีความสัญญาณตัวบ่งชี้ที่ผิดพลาด
ตีความสัญญาณที่ผุดขึ้นมาในตัวบ่งชี้ตลาดตามลำดับ โดยเริ่มจากการทำความเข้าใจวิธีการทำงานและสิ่งที่มันใช้เพื่อวัด ความล้มเหลวในการเทรดมักเป็นผลมาจากการเพิกเฉยหรือไม่เข้าใจรายละเอียดปลีกย่อยของตัวบ่งชี้นั้นๆ
You may also like
ความล้มเหลวในการคำนึงถึงบริบทของตลาด
ตัวบ่งชี้ตลาดเหล่านี้ไม่ได้ทำงานแบบแยกส่วน ความหมายและความสำคัญของตัวบ่งชี้อาจเปลี่ยนแปลงไปตามสภาพแวดล้อมโดยรวมของตลาด การพยายามตีความตัวบ่งชี้เหล่านี้ในบริบทที่เหมาะสมของแนวโน้ม ความผันผวน และความเชื่อมั่นของนักลงทุนในขณะนั้นเป็นสิ่งที่ควรทำเสมอ
ความประมาทในการบริหารความเสี่ยง
แม้แต่กลยุทธ์การซื้อขายที่ใช้ตัวชี้วัดที่ซับซ้อนที่สุดก็ยังต้องรับมือกับเหตุการณ์ที่ไม่คาดคิดในตลาดและภาวะขาดทุนอยู่เสมอ เว้นแต่คุณจะพัฒนาแนวทางการบริหารความเสี่ยงที่มีประสิทธิภาพ ซึ่งรวมถึงการวางคำสั่ง Stop Loss และการกำหนดขนาดสถานะ คุณก็ย่อมมีความเสี่ยงเกินกว่าขีดจำกัดที่ยอมรับได้
บทสรุป
ตัวบ่งชี้ตลาดเป็นเครื่องมือวิเคราะห์ที่ทรงพลังซึ่งให้ข้อมูลเชิงลึกเกี่ยวกับภาวะตลาดและแนวโน้มทิศทางในตลาดการเงิน ให้ความสำคัญกับตัวชี้วัดเชิงกว้าง ความเชื่อมั่น และโมเมนตัมที่หลากหลาย เพื่อความชัดเจนอย่างสมบูรณ์เกี่ยวกับสภาวะตลาดในขณะนั้น เพื่อสนับสนุนการตัดสินใจซื้อขายและการลงทุนอย่างชาญฉลาด
FAQ
ตัวบ่งชี้คือการวัดทางสถิติที่สะท้อนถึงสภาวะตลาดในปัจจุบัน เพื่อใช้ในการคาดการณ์อนาคต เทรดเดอร์และนักลงทุนใช้ตัวบ่งชี้เพื่อวิเคราะห์พฤติกรรมของตลาด ค้นหาโอกาสในการซื้อขาย และประเมินความเสี่ยง
ประเภทหลักของตัวบ่งชี้ตลาด ได้แก่: 1. ตัวบ่งชี้ความกว้าง: เส้น Advance-Decline, McClellan Oscillator 2. ตัวบ่งชี้ความรู้สึก: อัตราส่วน Put-Call, VIX 3. ตัวบ่งชี้แนวโน้ม: ค่าเฉลี่ยเคลื่อนที่, MACD 4. ตัวบ่งชี้ความผันผวน: แถบ Bollinger, ช่วงจริงเฉลี่ย 5. ตัวบ่งชี้ปริมาณ: ปริมาณที่สมดุล
1. ติดตามแนวโน้มด้วยค่าเฉลี่ยเคลื่อนที่ 2. วิเคราะห์โมเมนตัมด้วย RSI และ Stochastics 3. ควบคุมความผันผวนด้วย Bollinger Bands 4. วัดความเชื่อมั่น: ด้วย VIX และอัตราส่วน Put-Call 5. ยืนยัน Broadth ด้วยตัวบ่งชี้ Broadth
อัปเดต:
20 ธันวาคม 2567


