Volver
Contents
Velas Heikin Ashi: Definición, Descripción General, Cómo Usarlas

Vitaly Makarenko
Chief Commercial Officer

Demetris Makrides
Senior Business Development Manager
Heikin Ashi es un indicador basado en velas específicas que se diferencia de las velas japonesas tradicionales por su visualización más brillante. Los operadores utilizan las velas Heikin Ashi para obtener una señal más potente que les informe sobre un posible cambio de tendencia.
¿Cómo funciona el indicador y cuáles son las principales estrategias comerciales basadas en las velas Heikin Ashi?
La historia del indicador Heikin Ashi
El término "Heikin Ashi" significa "barra en el medio/barra promedio" al traducirse del japonés. Este indicador apareció en el siglo XVIII y el creador de las velas Heikin Ashi fue Munehisa Homma, un comerciante de arroz de Sakata. Munehisa también introdujo el gráfico de velas tradicional, por lo que Heikin Ashi se considera una versión reorganizada de las velas japonesas.
Las diferencias entre las velas Heikin Ashi y los candelabros japoneses
Una vela japonesa tradicional proporciona a los operadores la siguiente información:
- precio de apertura;
- precio de cierre;
- precio mínimo;
- precio máximo.
Los precios de apertura y cierre están representados por el cuerpo de una vela y las sombras marcan los precios mínimos y máximos dentro de un período de tiempo determinado.
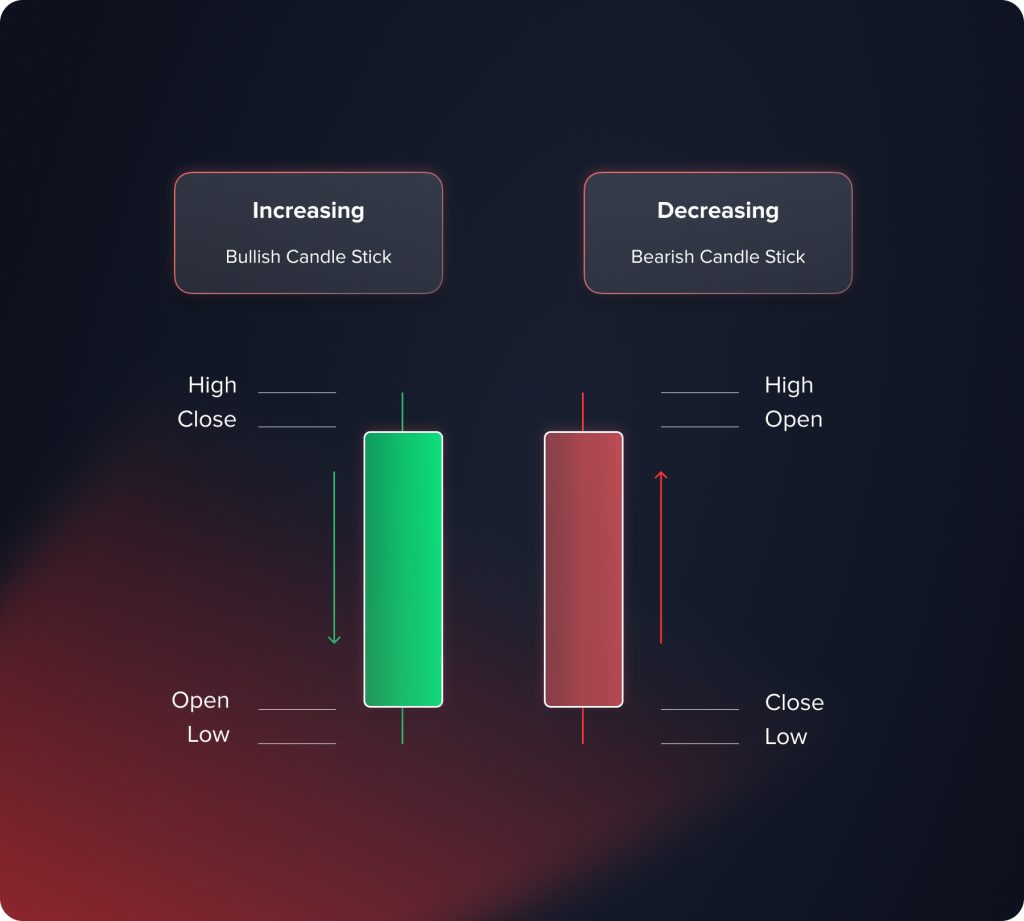
Cuando el mercado experimenta alta volatilidad, las velas alcistas y bajistas se alternan en el gráfico, lo que dificulta enormemente definir la tendencia actual. Las velas Heikin Ashi modificadas solucionan este problema.
En lugar de indicar precios de apertura, cierre, mínimo y máximo, Heikin Ashi representa los significados promedio de todos los indicadores.
La siguiente imagen ilustra cómo se construyen las velas tradicionales y las velas Heikin Ashi para el gráfico EUR/USD (período D1). Las velas Heikin Ashi son más suaves. No presentan gaps y los operadores pueden ignorar los ruidos del mercado.
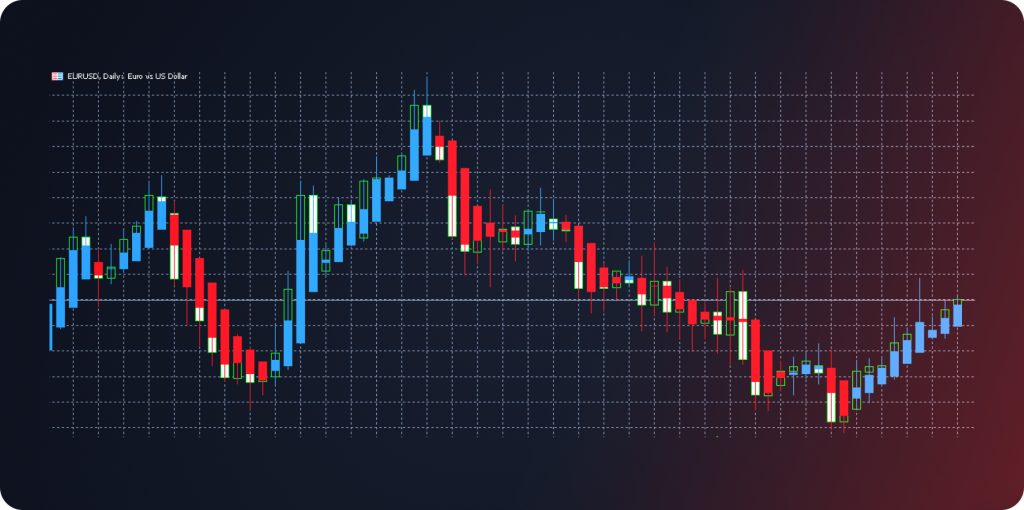
Las velas Heikin Ashi se fabrican según la siguiente fórmula:
- Precio abierto = (precio de apertura de la barra anterior + precio de cierre de la barra anterior) / 2;
- Precio de cierre = (precio de apertura + precio máximo + precio mínimo + precio de cierre) / 4;
- Precio máximo = (el precio más alto tomado del precio máximo, de apertura o de cierre);
- Precio mínimo = (el precio más bajo tomado del precio mínimo, de apertura o de cierre).
Los traders frecuentemente comparan el indicador Heikin Ashi con los promedios móviles, ya que ambos instrumentos brindan a los traders datos de mercado fluidos que ignoran la volatilidad y los ruidos a corto plazo.
Señales Heikin Ashi
Mediante las velas Heikin Ashi, los operadores obtienen la siguiente información importante: la dirección de la tendencia actual del mercado, sus puntos inicial y final; por lo tanto, pueden abrir o cerrar posiciones. ¿Cómo identificar señales con este indicador?
- Cuando el precio de un activo sube o baja constantemente, las sombras mínimas e inexistentes son indicadores importantes de una tendencia en curso. Por ejemplo, en un mercado alcista, las velas Heikin Ashi tienen sombras inferiores mínimas o inexistentes, y viceversa.
- El nivel de apertura de la barra es otro indicador importante. Cuando una tendencia domina el mercado, suele abrirse una nueva vela en medio de la barra anterior.
- También debe tenerse en cuenta el color de las velas. Heikin Ashi utiliza datos de mercado uniformes; por ello, la predominancia de velas azules (verdes) indica una tendencia alcista, mientras que la predominancia de velas rojas indica una tendencia bajista.
El tamaño de las velas ayuda a los operadores a comprender la fuerza de la tendencia actual. Cuando el cuerpo de cada vela es mayor que el de la anterior, la fuerza de la tendencia aumenta. La disminución del tamaño de las velas indica una reducción de la fuerza de una tendencia y su posible reversión.
Apliquemos las señales mencionadas a un gráfico real. Como ejemplo, usaremos el gráfico XAU/USD (oro vs. dólar estadounidense).
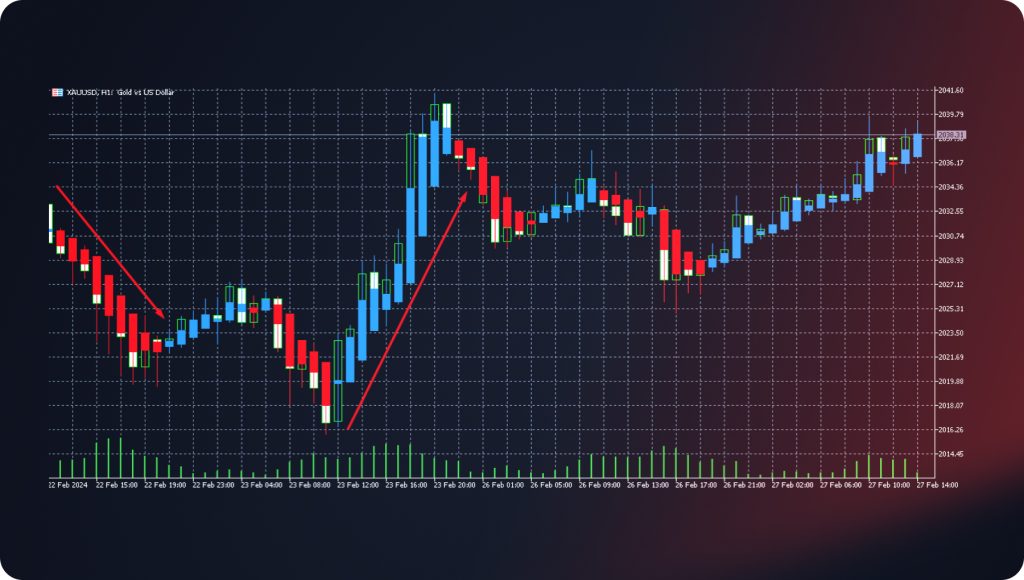
Cuando la tendencia bajista domina el mercado, las velas rojas presentan sombras superiores mínimas o inexistentes. Cuando esta aparece, la tendencia pierde fuerza, lo que indica una posible reversión. Además, las velas Heikin Ashi muestran a los operadores un movimiento de precios más preciso. En un gráfico tradicional, observamos la combinación de velas alcistas y bajistas cuando las velas del instrumento Heikin Ashi son estrictamente alcistas o bajistas.
Patrones Heikin Ashi
Los patrones gráficos se encuentran entre los instrumentos más utilizados para ayudar a los operadores a comprender el mejor momento para entrar al mercado. En el caso de las velas Heikin Ashi, los patrones son señales más precisas. ¿Cuáles son los patrones gráficos más comunes y útiles?
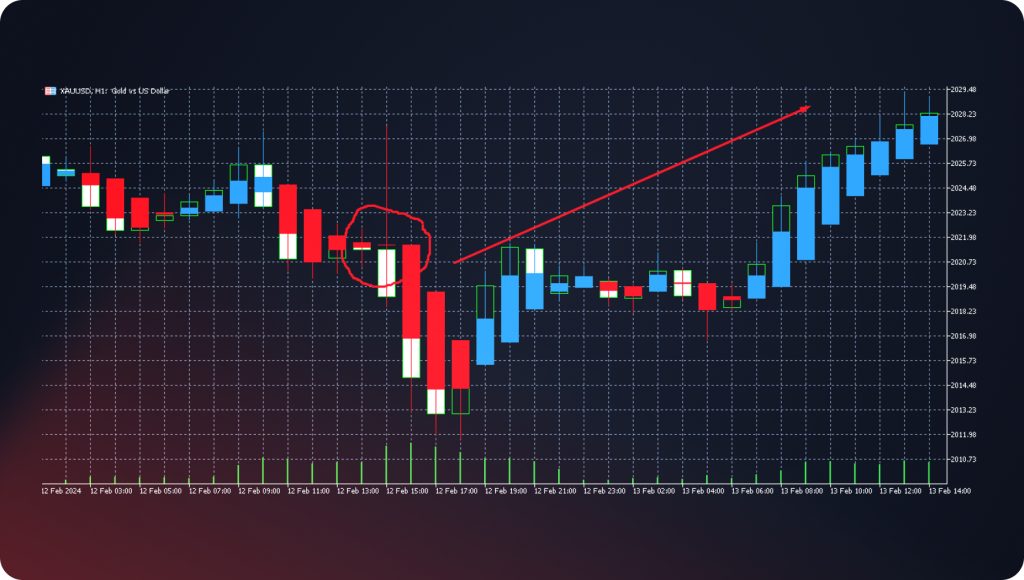
Doji
Cuando los precios de apertura y cierre son iguales, aparece el patrón Doji. Una vela tiene un cuerpo inexistente, representado por una línea horizontal y largas sombras superior e inferior. Este patrón muestra que ni los alcistas ni los bajistas dominan. El Doji se clasifica como un patrón de reversión: cuando aparece al final del mercado alcista, los operadores abren posiciones cortas, y viceversa.
Cruz Harami
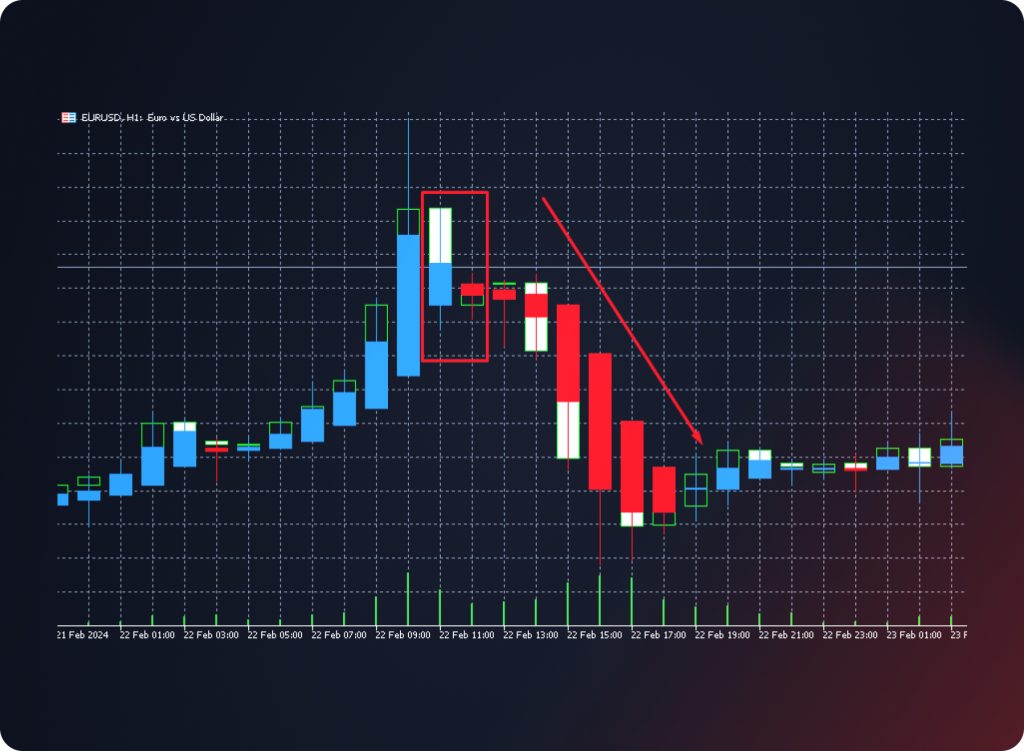
Este patrón consta de dos velas y también representa la categoría de patrones de reversión. La cruz Harami incluye dos velas de diferentes colores. La primera vela tiene un cuerpo grande, mientras que la siguiente se asemeja al patrón Doji. La única diferencia radica en que la cruz Harami tiene un cuerpo mínimo, no solo una línea horizontal. Tenga en cuenta que las sombras de la segunda vela no deben cruzarse con las de la anterior. Cuando la cruz Harami aparece en el gráfico, los operadores deben estar preparados para una reversión de la tendencia.
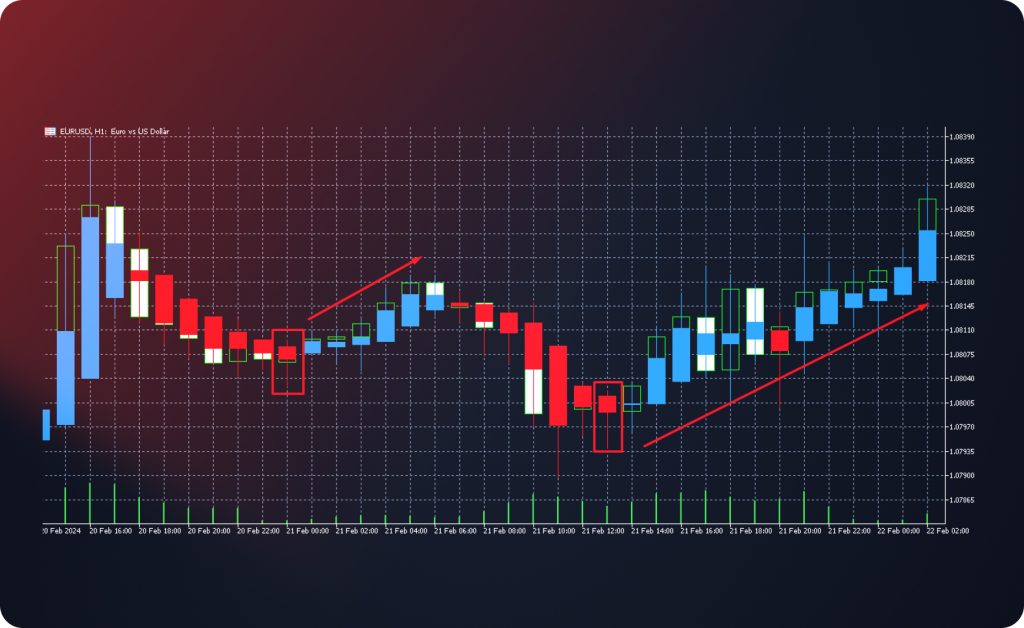
Martillo / Hombre colgado
Este patrón de vela consiste en una vela con un cuerpo mínimo, una sombra superior mínima o inexistente y una sombra inferior larga. Gráficamente, el patrón se asemeja a un martillo. Cuando el patrón aparece en un mercado alcista, se denomina "Hombre Colgado". Cuando un operador identifica el patrón de martillo (hombre colgado), abre posiciones en direcciones opuestas.
Estrella fugaz
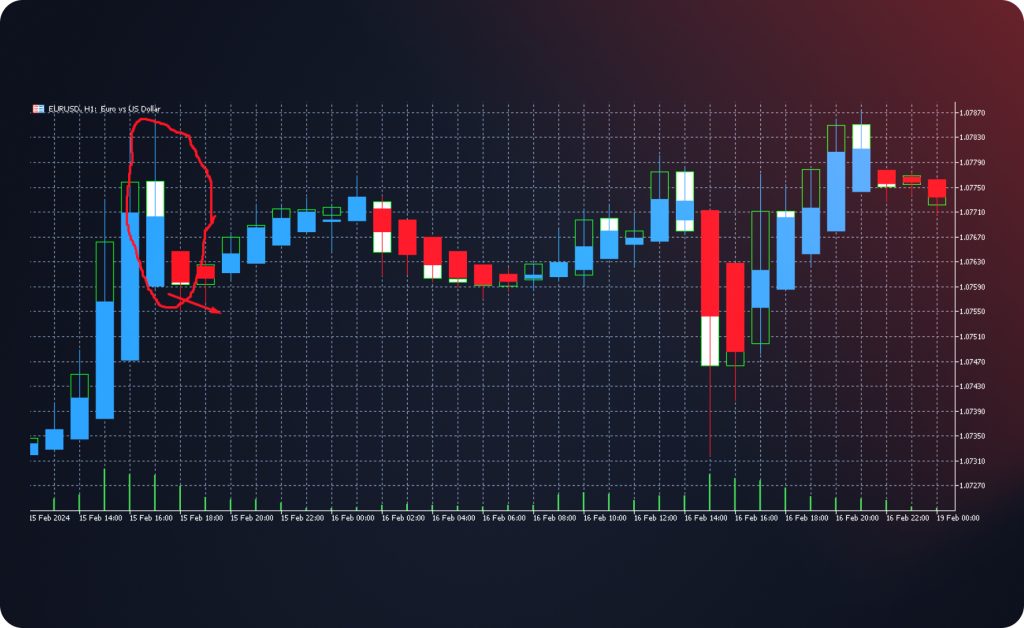
Este patrón gráfico aparece en el mercado alcista e indica la reversión más cercana. La estrella fugaz tiene una sombra superior larga, al menos dos veces mayor que el cuerpo de la vela. La sombra inferior debe ser mínima o estar ausente (menos del 10% del cuerpo). La vela siempre es azul (verde). Cuando aparece la estrella fugaz, los operadores abren posiciones cortas.
Onda alta
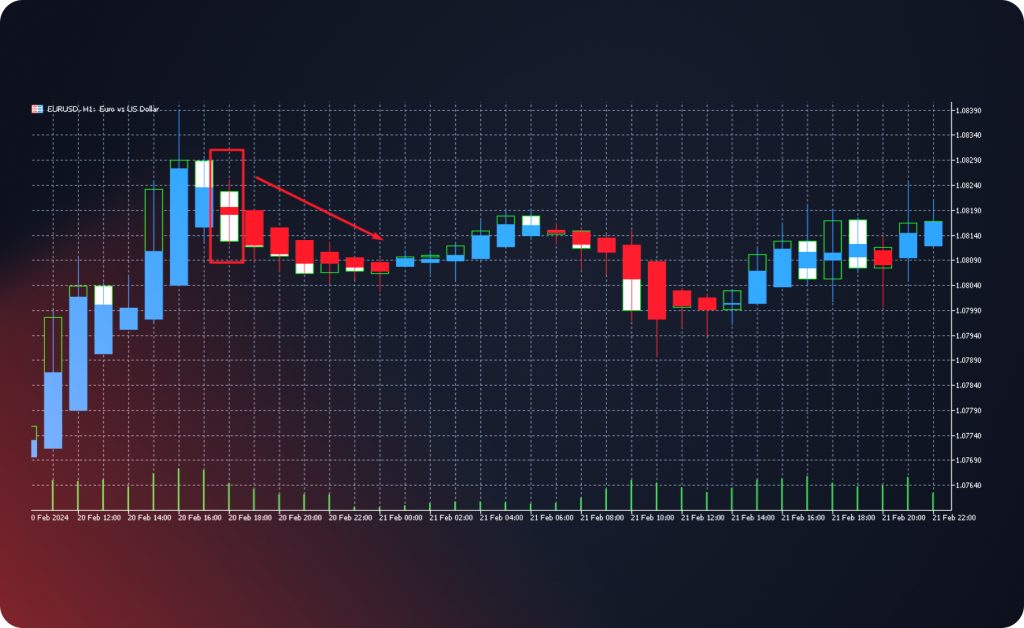
Las ondas altas son velas con sombras superiores e inferiores largas y del mismo tamaño. Estas velas cumplen la misma función que el patrón Doji. Indican que el mercado experimenta un equilibrio entre alcistas y bajistas, por lo que la tendencia anterior pierde fuerza.
¿Cómo utilizar Heikin Ashi para identificar la tendencia actual?
Los operadores experimentados utilizan el instrumento Heikin Ashi para identificar la tendencia actual del mercado. Los siguientes factores son fundamentales:
- la longitud del cuerpo de una vela y cómo cambia;
- la relación entre el cuerpo y las sombras de una vela;
- el tipo dominante de velas (alcistas o bajistas);
- La dirección del movimiento del precio.
Entendamos cómo utilizar los factores mencionados para identificar tendencias alcistas y bajistas.
La tendencia alcista del mercado (según Heikin Ashi)
Los siguientes marcadores informan a un comerciante que la tendencia alcista domina el mercado:
- El precio está subiendo.
- Las velas alcistas verdes (azules) dominan el gráfico.
- Cuando los cuerpos de las velas alcistas se hacen más grandes, la fuerza de la tendencia alcista aumenta. Cuando sus cuerpos se hacen más pequeños, la tendencia pierde fuerza.
- Las sombras inferiores mínimas o nulas indican una fuerte tendencia alcista.
La tendencia bajista del mercado (según Heikin Ashi)
Los siguientes marcadores informan a un comerciante que la tendencia bajista domina el mercado:
- El precio esta bajando
- Las velas bajistas rojas dominan el gráfico.
- Cuando los cuerpos de las velas bajistas se hacen más grandes, la fuerza de la tendencia bajista aumenta. Cuando sus cuerpos se hacen más pequeños, la tendencia pierde fuerza.
- Las sombras superiores mínimas o nulas indican una fuerte tendencia bajista.
Análisis de tendencias basado en velas Heikin Ashi (par de divisas GBP/USD)
Ilustremos la información anterior con un ejemplo. El indicador Heikin Ashi se aplica al gráfico GBP/USD para comprender la tendencia actual del mercado y su fortaleza.
Las velas azules nos indican que la tendencia alcista domina el mercado. Las velas no tienen sombras inferiores; por lo tanto, la tendencia es bastante fuerte. Por otro lado, los cuerpos de las velas aumentan de tamaño hasta 5.el candle, and elen bodies are getting smaller. Such a tendency may indicate elat ele bullish trend becomes weaker.
Heikin Ashi es un indicador útil, pero los traders experimentados lo combinan con otros instrumentos para obtener señales más precisas.
Las combinaciones de Heikin Ashi con otros instrumentos de análisis técnico
La combinación de Heikin Ashi y la media móvil
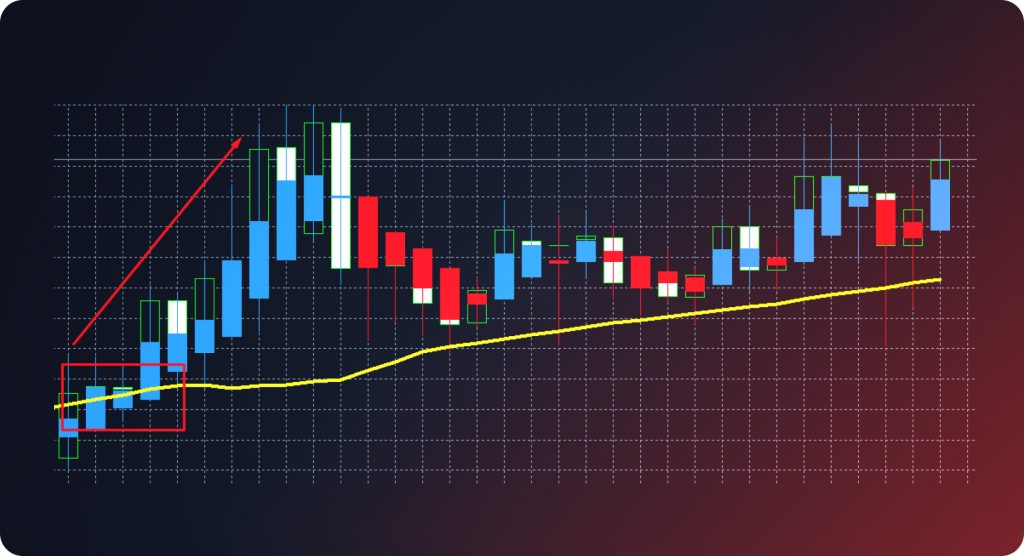
Algunos operadores combinan el Heikin Ashi con indicadores de momentum. Por ejemplo, se puede añadir el indicador de media móvil al gráfico (la línea SMA con un periodo de 50). Cuando una vela Heikin Ashi cruza la SMA de 50, se puede abrir una posición:
- Abra una posición larga cuando una vela Heikin Ashi verde (azul) cruce la línea SMA 50 de abajo hacia arriba.
- Abra una posición corta cuando una vela Heikin Ashi roja cruce la línea SMA 50 de arriba hacia abajo.
La combinación de la nube Ichimoku y Heikin Ashi
Agregue la nube Ichimoku al gráfico con la configuración predeterminada (9, 26, 52). Tenga en cuenta las siguientes condiciones al entrar en el mercado:
- Abra una posición larga cuando una vela abandone la nube Kumo y cierre por encima de ella. El Tenkan Sen es superior al Kijun Sen. El Chikou Span es superior al gráfico de precios y pertenece a la tendencia alcista. El Senkou Span A es superior al Senkou Span B. Una vela Heikin Ashi es alcista (verde o azul).
- Abra una posición corta cuando una vela abandone la nube de Kumo y cierre por debajo. El Tenkan Sen es inferior al Kijun Sen. El Chikou Span es inferior al gráfico de precios y pertenece a la tendencia bajista. El Senkou Span A es inferior al Senkou Span B. Una vela Heikin Ashi es bajista (roja).
Los pros y contras del indicador Heikin Ashi
Las ventajas de Heikin Ashi son las siguientes:
- El indicador se basa en un sistema visual simple y efectivo.
- Este indicador es una solución perfecta para marcos temporales largos.
- Las velas Heikin Ashi se definen fácilmente por color y los operadores no necesitan recordar combinaciones complicadas.
Las desventajas de Heikin Ashi son las siguientes:
- El indicador no coincide con el estilo de trading impulsivo.
- Heikin Ashi proporciona a los operadores señales más precisas cuando se aplica al marco temporal H4 o superior.
- El indicador Heikin Ashi debe combinarse con otros indicadores antes de abrir posiciones.
En resumen
Heikin Ashi es un indicador ampliamente utilizado por operadores profesionales para identificar la tendencia actual. Basándose en el color, el tamaño del cuerpo y las sombras de las velas, se puede comprender qué tendencia domina el mercado y su fuerza. La combinación de Heikin Ashi con otros instrumentos proporciona a los operadores señales más precisas para abrir posiciones largas y cortas.
Actualizado:
19 de diciembre de 2024