
Heikin Ashi là một chỉ báo dựa trên các nến cụ thể, khác với nến Nhật Bản truyền thống ở khả năng hiển thị sáng sủa hơn. Các nhà giao dịch sử dụng nến Heikin Ashi để có được tín hiệu mạnh hơn, giúp họ dự đoán khả năng thay đổi xu hướng.
Chỉ báo này hoạt động như thế nào và các chiến lược giao dịch chính dựa trên nến Heikin Ashi là gì?
Lịch sử của chỉ báo Heikin Ashi
Thuật ngữ "Heikin Ashi" có nghĩa là "thanh ở giữa/thanh trung bình" khi dịch từ tiếng Nhật. Một chỉ báo như vậy xuất hiện vào những năm 1700 và người sáng tạo ra nến Heikin Ashi là Munehisa Homma, một thương gia gạo đến từ Sakata. Munehisa cũng giới thiệu biểu đồ nến truyền thống; đó là lý do tại sao Heikin Ashi được hiểu là một phiên bản cải tiến của nến Nhật.
Sự khác biệt giữa nến Heikin Ashi và nến Nhật Bản
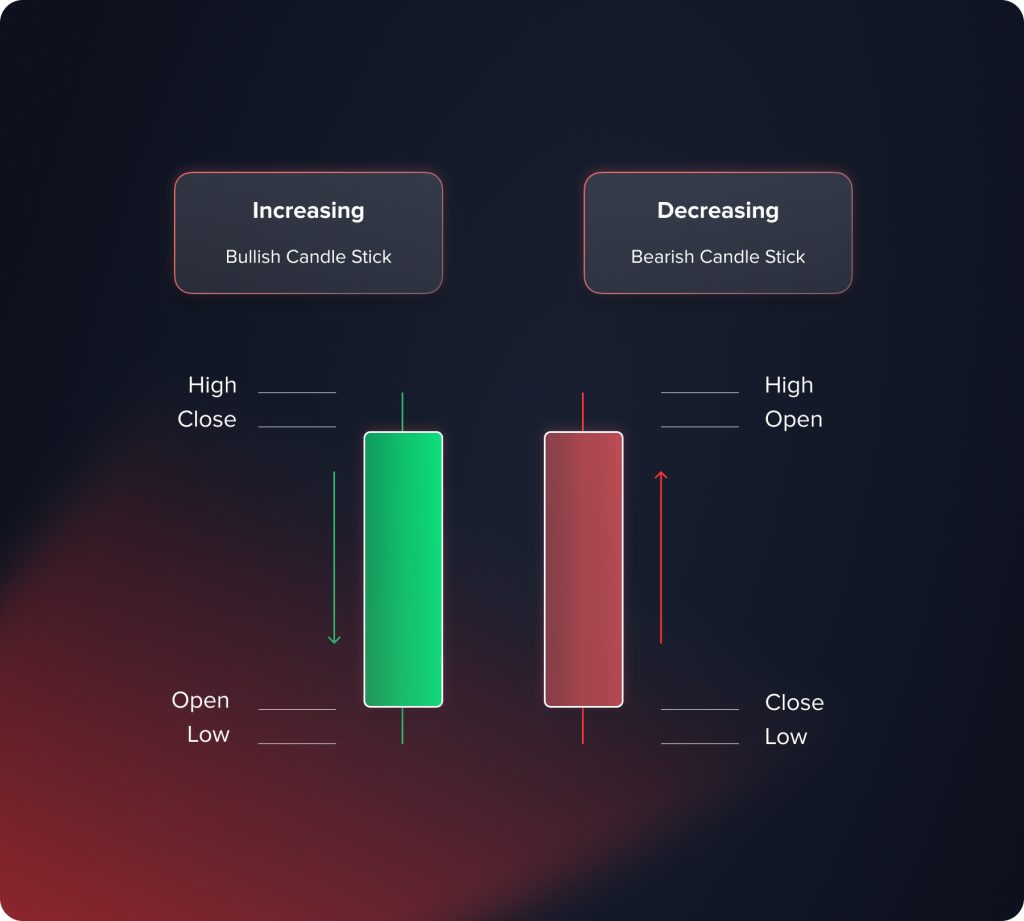
Nến Nhật truyền thống cung cấp cho các nhà giao dịch những thông tin sau:
- giá mở cửa;
- giá đóng cửa;
- giá tối thiểu;
- giá tối đa.
Giá mở và giá đóng được biểu thị bằng thân nến và bóng nến đánh dấu giá tối thiểu và tối đa trong một khung thời gian nhất định.
Khi thị trường biến động mạnh, nến tăng và nến giảm xen kẽ trên biểu đồ, khiến việc xác định xu hướng hiện tại trở nên cực kỳ khó khăn. Nến Heikin Ashi điều chỉnh giải quyết vấn đề này.
Thay vì chỉ ra giá mở cửa, đóng cửa, giá tối thiểu và giá tối đa, Heikin Ashi thể hiện ý nghĩa trung bình của tất cả các chỉ báo.
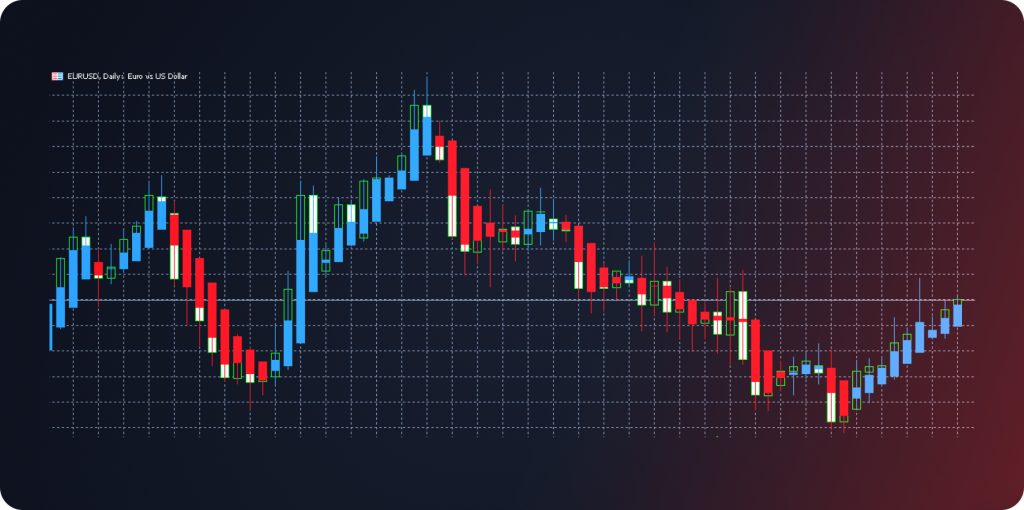
Hình ảnh sau đây minh họa cách xây dựng nến truyền thống và nến Heikin Ashi cho biểu đồ EUR/USD (khung thời gian D1). Nến Heikin Ashi mượt mà hơn. Không có khoảng trống giá (gap), và các nhà giao dịch có thể bỏ qua các tín hiệu thị trường.
Nến Heikin Ashi được chế tạo theo công thức sau:
- Giá mở cửa = (giá mở cửa của thanh trước đó + giá đóng cửa của thanh trước đó) / 2;
- Giá đóng cửa = (giá mở cửa + giá cao nhất + giá thấp nhất + giá đóng cửa) / 4;
- Giá tối đa = (giá cao nhất lấy từ giá tối đa, giá mở cửa hoặc giá đóng cửa);
- Giá tối thiểu = (giá thấp nhất được lấy từ giá tối thiểu, giá mở cửa hoặc giá đóng cửa).
Các nhà giao dịch thường so sánh chỉ báo Heikin Ashi với Đường trung bình động vì cả hai công cụ này đều cung cấp cho các nhà giao dịch dữ liệu thị trường mượt mà, bỏ qua biến động và nhiễu trong ngắn hạn.
Tín hiệu Heikin Ashi
Sử dụng nến Heikin Ashi, các nhà giao dịch có được những thông tin quan trọng sau: hướng đi của xu hướng thị trường hiện tại, điểm bắt đầu và kết thúc; đó là lý do tại sao họ có thể mở hoặc đóng vị thế. Làm thế nào để xác định tín hiệu dựa trên chỉ báo này?
- Khi giá của một tài sản tăng hoặc giảm đều đặn, bóng nến nhỏ nhất hoặc không tồn tại là những chỉ báo quan trọng cho thấy xu hướng đang diễn ra. Ví dụ, trên thị trường tăng giá, nến Heikin Ashi có bóng nến dưới nhỏ nhất hoặc không tồn tại, và ngược lại.
- Mức mở cửa của thanh nến là một chỉ báo quan trọng khác. Khi một xu hướng nhất định chiếm ưu thế trên thị trường, một nến mới thường mở cửa ở giữa thanh nến trước đó.
- Màu sắc của nến cũng cần được lưu ý. Heikin Ashi sử dụng dữ liệu thị trường trơn tru; đây là lý do tại sao sự thống trị của nến xanh lam (xanh lá cây) cho thấy xu hướng tăng giá, trong khi sự thống trị của nến đỏ cho thấy xu hướng giảm giá.
Kích thước nến giúp nhà giao dịch hiểu được sức mạnh của xu hướng hiện tại. Khi thân nến tiếp theo lớn hơn nến trước, sức mạnh của xu hướng đang tăng lên. Kích thước nến giảm cho thấy sức mạnh của xu hướng đang giảm và khả năng đảo chiều.
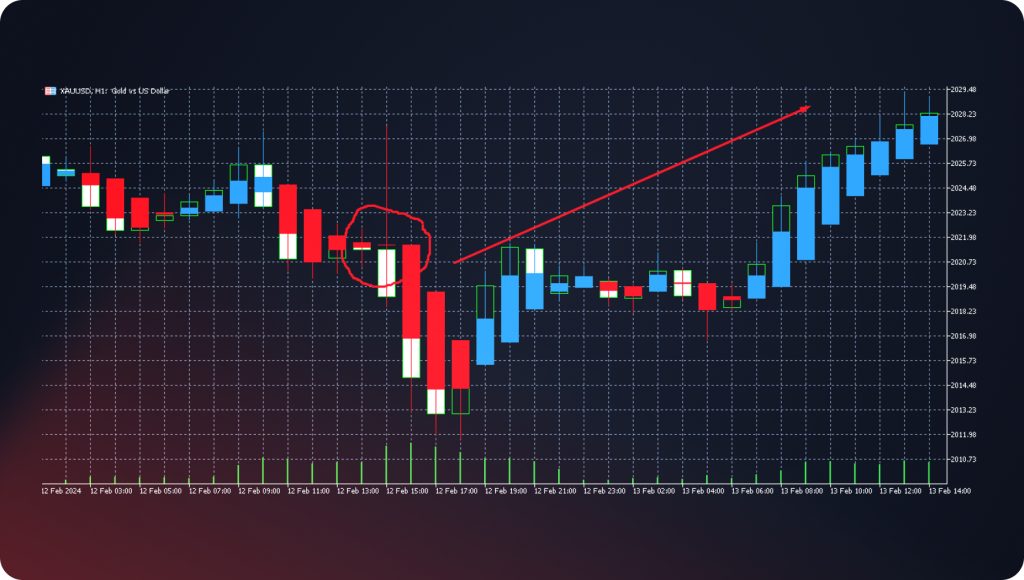
Hãy áp dụng các tín hiệu nêu trên vào một biểu đồ thực tế. Ví dụ, chúng ta sử dụng biểu đồ XAU/USD (vàng so với đô la Mỹ).
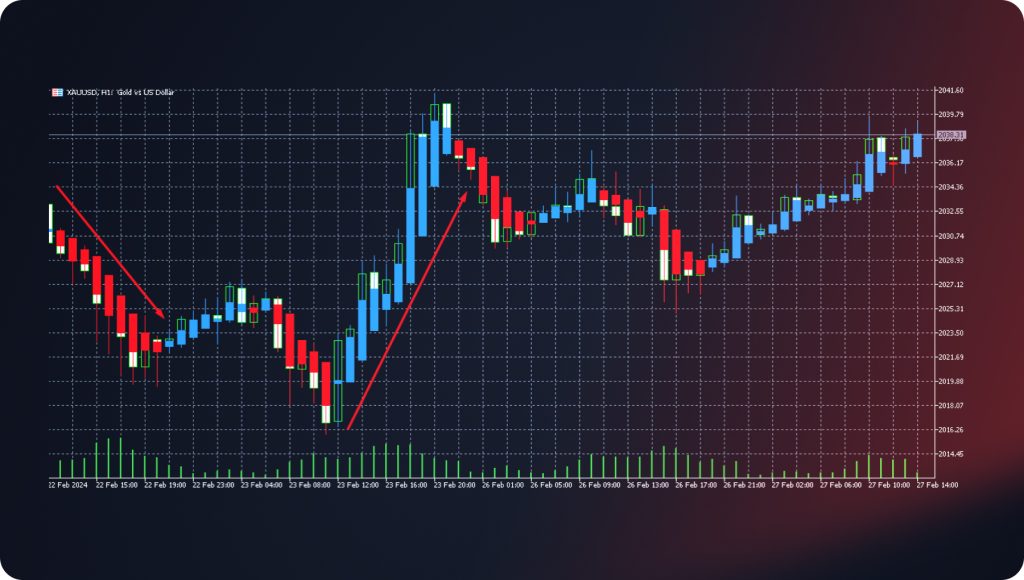
Khi xu hướng giảm đang chiếm ưu thế trên thị trường, nến đỏ có rất ít hoặc không có bóng trên. Khi bóng trên xuất hiện, xu hướng mất đi sức mạnh, đồng nghĩa với khả năng đảo chiều. Hơn nữa, nến Heikin Ashi cho nhà giao dịch thấy biến động giá chính xác hơn. Trên biểu đồ truyền thống, chúng ta thấy sự kết hợp của nến tăng và nến giảm khi nến Heikin Ashi chỉ mang tính chất tăng hoặc giảm.
Mẫu Heikin Ashi
Các mô hình biểu đồ là một trong những công cụ được sử dụng rộng rãi nhất, giúp các nhà giao dịch nắm bắt được thời điểm tốt nhất để tham gia thị trường. Khi nói đến nến Heikin Ashi, các mô hình này là những tín hiệu chính xác hơn. Vậy những mô hình biểu đồ nào phổ biến và hữu ích nhất?
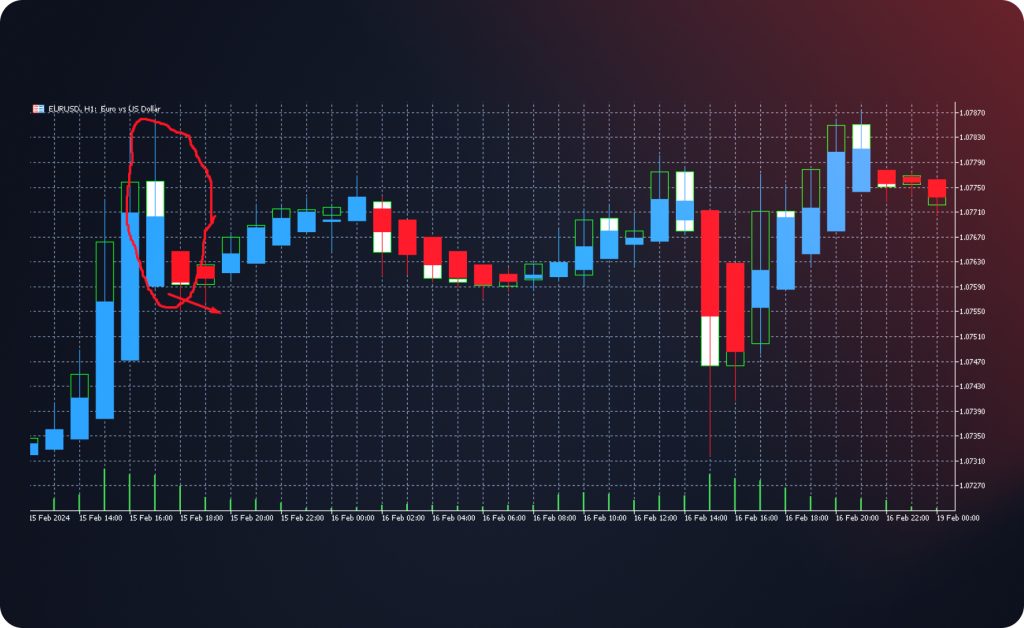
Doji
Khi giá mở cửa và giá đóng cửa bằng nhau, mô hình Doji xuất hiện. Một cây nến có thân nến không tồn tại được biểu thị bằng một đường ngang và bóng nến trên và dưới dài. Mô hình này cho thấy cả phe mua lẫn phe bán đều không chiếm ưu thế. Doji thuộc nhóm mô hình đảo chiều – khi nó xuất hiện vào cuối thị trường tăng giá, các nhà giao dịch mở các vị thế bán, và ngược lại.
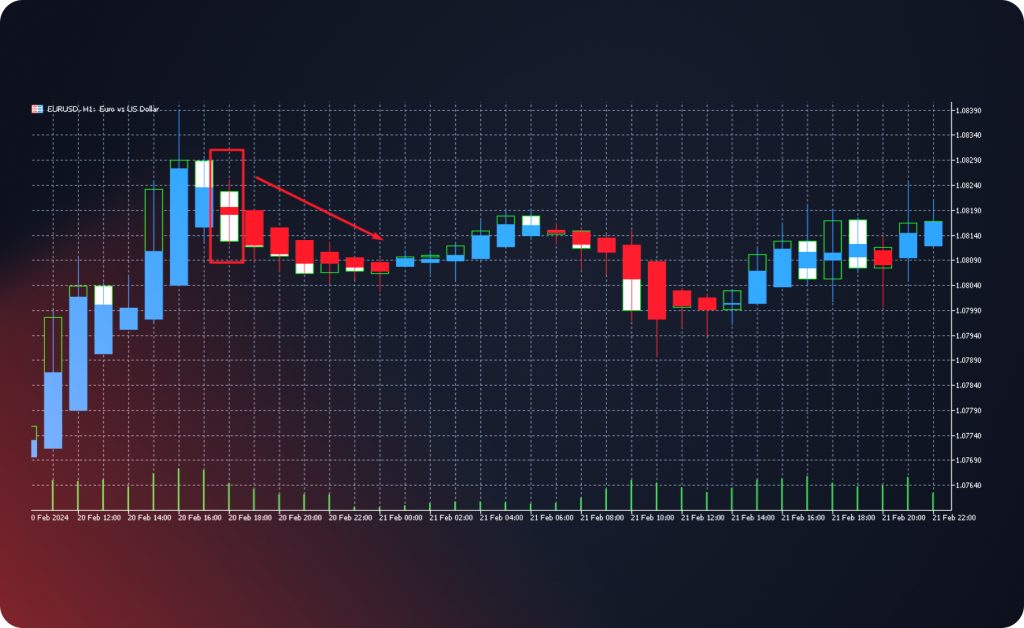
Thập tự giá Harami
Mô hình này bao gồm hai nến và cũng đại diện cho thể loại mô hình đảo chiều. Harami Cross bao gồm hai nến có màu sắc khác nhau. Nến đầu tiên có thân nến lớn trong khi nến tiếp theo trông giống mô hình Doji. Điểm khác biệt duy nhất nằm ở chỗ Harami Cross có thân nến nhỏ nhất, không chỉ là một đường ngang. Lưu ý rằng bóng của nến thứ hai không được cắt bóng của nến trước đó. Khi Harami Cross xuất hiện trên biểu đồ, các nhà giao dịch nên sẵn sàng cho một sự đảo chiều xu hướng.
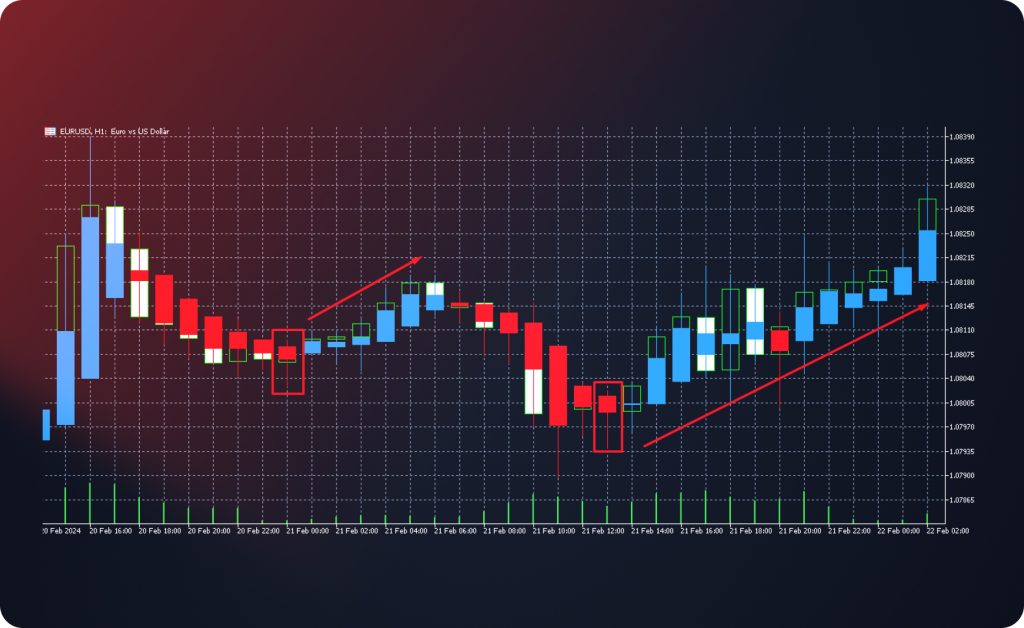
Búa / Người treo cổ
Mô hình nến này bao gồm một nến có thân nến nhỏ nhất, bóng trên nhỏ nhất hoặc không có, và bóng dưới dài. Về mặt đồ họa, mô hình này giống với một cây búa. Khi mô hình xuất hiện trong thị trường tăng giá, nó được gọi là mô hình Người treo cổ. Khi một nhà giao dịch xác định được mô hình Người treo cổ, họ sẽ mở vị thế theo hướng ngược lại.
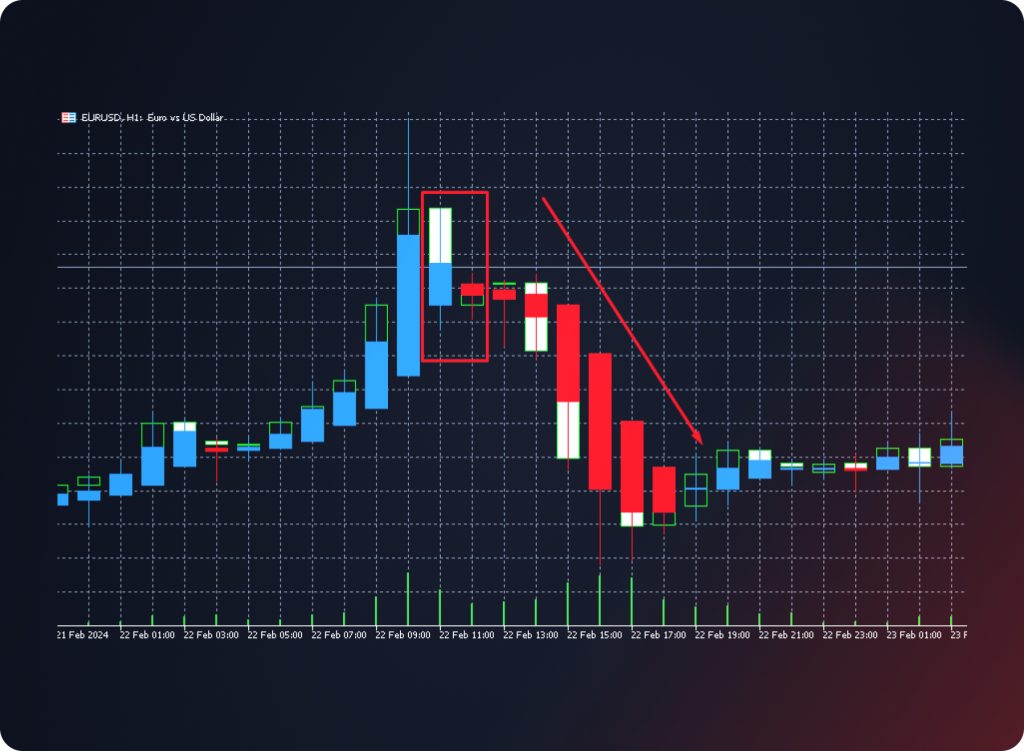
Sao băng
Mẫu hình này xuất hiện trong thị trường tăng giá và báo hiệu sự đảo chiều gần nhất. Mô hình Shooting Star có bóng trên dài hơn thân nến ít nhất gấp đôi. Bóng dưới phải không có hoặc nhỏ hơn 10% thân nến. Nến luôn có màu xanh lam (xanh lá cây). Khi Shooting Star xuất hiện, các nhà giao dịch mở vị thế bán.
Sóng cao
Sóng cao là những nến có bóng trên và bóng dưới dài, cùng kích thước. Những nến này có vai trò tương tự như mô hình Doji. Sóng cao cho thấy thị trường đang trải qua sự cân bằng giữa phe mua và phe bán; đó là lý do tại sao xu hướng trước đó mất đi sức mạnh.
Làm thế nào để sử dụng Heikin Ashi để xác định xu hướng hiện tại?
Các nhà giao dịch giàu kinh nghiệm sử dụng công cụ Heikin Ashi để xác định xu hướng thị trường hiện tại. Các yếu tố sau đây rất quan trọng:
- chiều dài của thân nến và cách nó thay đổi;
- tỷ lệ giữa thân nến và bóng nến;
- loại nến chiếm ưu thế (tăng giá hoặc giảm giá);
- hướng chuyển động của giá.
Hãy cùng tìm hiểu cách sử dụng các yếu tố đã đề cập để xác định xu hướng tăng giá và giảm giá.
Xu hướng thị trường tăng giá (Theo Heikin Ashi)
Các dấu hiệu sau đây cho nhà giao dịch biết rằng xu hướng tăng giá đang chiếm ưu thế trên thị trường:
- Giá đang tăng cao.
- Nến tăng giá màu xanh lá cây (xanh lam) đang chiếm ưu thế trên biểu đồ.
- Khi thân nến tăng lớn hơn, sức mạnh của xu hướng tăng sẽ tăng lên. Khi thân nến giảm, xu hướng giảm dần.
- Bóng dưới tối thiểu hoặc không có bóng dưới cho thấy xu hướng tăng mạnh.
Xu hướng thị trường giảm giá (Theo Heikin Ashi)
Các dấu hiệu sau đây cho nhà giao dịch biết rằng xu hướng giảm đang chiếm ưu thế trên thị trường:
- Giá đang giảm dần.
- Nến đỏ giảm giá đang chiếm ưu thế trên biểu đồ.
- Khi thân nến giảm lớn hơn, sức mạnh của xu hướng giảm sẽ tăng lên. Khi thân nến giảm nhỏ hơn, xu hướng giảm sẽ mất đi sức mạnh.
- Bóng trên tối thiểu hoặc không có bóng trên cho thấy xu hướng giảm mạnh.
Phân tích xu hướng dựa trên nến Heikin Ashi (Cặp tiền tệ GBP/USD)
Hãy minh họa thông tin nêu trên bằng ví dụ. Chỉ báo Heikin Ashi được áp dụng cho biểu đồ GBP/USD để hiểu xu hướng thị trường hiện tại là gì và nó mạnh đến mức nào.
Nến xanh cho thấy xu hướng tăng đang chiếm ưu thế trên thị trường. Nến không có bóng dưới; do đó, xu hướng khá mạnh. Mặt khác, thân nến tăng dần kích thước lên đến 5.th Nến, và sau đó thân nến nhỏ dần. Xu hướng này có thể cho thấy xu hướng tăng đang yếu đi.
Heikin Ashi là một chỉ báo hữu ích nhưng các nhà giao dịch giàu kinh nghiệm kết hợp nó với các công cụ khác để có được tín hiệu chính xác hơn.
Sự kết hợp của Heikin Ashi với các công cụ phân tích kỹ thuật khác
Sự kết hợp của Heikin Ashi và Đường trung bình động
Một số nhà giao dịch kết hợp Heikin Ashi với các chỉ báo động lượng. Ví dụ, bạn có thể thêm chỉ báo Đường trung bình động (MA) vào biểu đồ (đường SMA với chu kỳ 50). Khi một nến Heikin Ashi cắt đường SMA 50, bạn có thể mở một vị thế:
- Mở vị thế mua khi nến Heikin Ashi màu xanh lá cây (xanh lam) cắt đường SMA 50 từ dưới lên.
- Mở vị thế bán khi nến Heikin Ashi màu đỏ cắt đường SMA 50 từ trên xuống.
Sự kết hợp của đám mây Ichimoku và Heikin Ashi
Thêm đám mây Ichimoku vào biểu đồ bằng các thiết lập mặc định (9, 26, 52). Cần lưu ý các điều kiện sau khi tham gia thị trường:
- Mở lệnh mua khi một nến rời khỏi đám mây Kumo và đóng cửa phía trên đám mây. Tenkan Sen cao hơn Kijun Sen. Chikou Span cao hơn biểu đồ giá và thuộc xu hướng tăng. Senkou Span A cao hơn Senkou Span B. Nến Heikin Ashi là nến tăng giá (xanh lá cây hoặc xanh lam).
- Mở vị thế bán khi nến rời khỏi đám mây Kumo và đóng cửa bên dưới. Tenkan Sen thấp hơn Kijun Sen. Chikou Span thấp hơn biểu đồ giá và thuộc xu hướng giảm. Senkou Span A thấp hơn Senkou Span B. Nến Heikin Ashi là nến giảm (màu đỏ).
Ưu và nhược điểm của chỉ báo Heikin Ashi
Ưu điểm của Heikin Ashi như sau:
- Chỉ số này dựa trên một hệ thống trực quan đơn giản và hiệu quả.
- Chỉ báo này là giải pháp hoàn hảo cho khung thời gian dài.
- Nến Heikin Ashi dễ dàng được xác định theo màu sắc và người giao dịch không cần phải nhớ những kết hợp phức tạp.
Nhược điểm của Heikin Ashi là:
- Chỉ báo này không phù hợp với phong cách giao dịch theo xung lực.
- Heikin Ashi cung cấp cho các nhà giao dịch những tín hiệu chính xác hơn khi áp dụng cho khung thời gian H4 hoặc cao hơn.
- Chỉ báo Heikin Ashi phải được kết hợp với các chỉ báo khác trước khi mở vị thế.
Kết luận
Heikin Ashi là một chỉ báo được các nhà giao dịch chuyên nghiệp sử dụng rộng rãi để xác định xu hướng hiện tại. Dựa trên màu sắc, kích thước thân nến và bóng nến, người ta có thể hiểu được xu hướng nào đang thống trị thị trường và mức độ mạnh yếu của nó. Sự kết hợp của Heikin Ashi với các công cụ khác cung cấp cho nhà giao dịch những tín hiệu chính xác hơn để mở các vị thế mua và bán.

