Voltar
Contents
Oscilador de Volume (VO): Definição, Tipos, Características, Estratégias, Prós e Contras

Demetris Makrides
Senior Business Development Manager

Vitaly Makarenko
Chief Commercial Officer
O Oscilador de Volume é um instrumento técnico utilizado para analisar os volumes da atividade de negociação. Esse indicador determina a diferença entre duas Médias Móveis de volume. Uma representação gráfica da diferença permite que os traders identifiquem padrões que indicam pressão de compra e venda no mercado.
Principais conclusões:
- O que significa o Oscilador de Volume?
- Como funciona o oscilador?
- Qual fórmula é usada para calcular o oscilador?
- Variações do oscilador de volume.
- Como os traders podem combinar o oscilador com outros instrumentos técnicos?
- Quais são as estratégias mais difundidas que incluem o Oscilador de Volume?
- Prós e contras do oscilador de volume.
O que é o oscilador de volume?
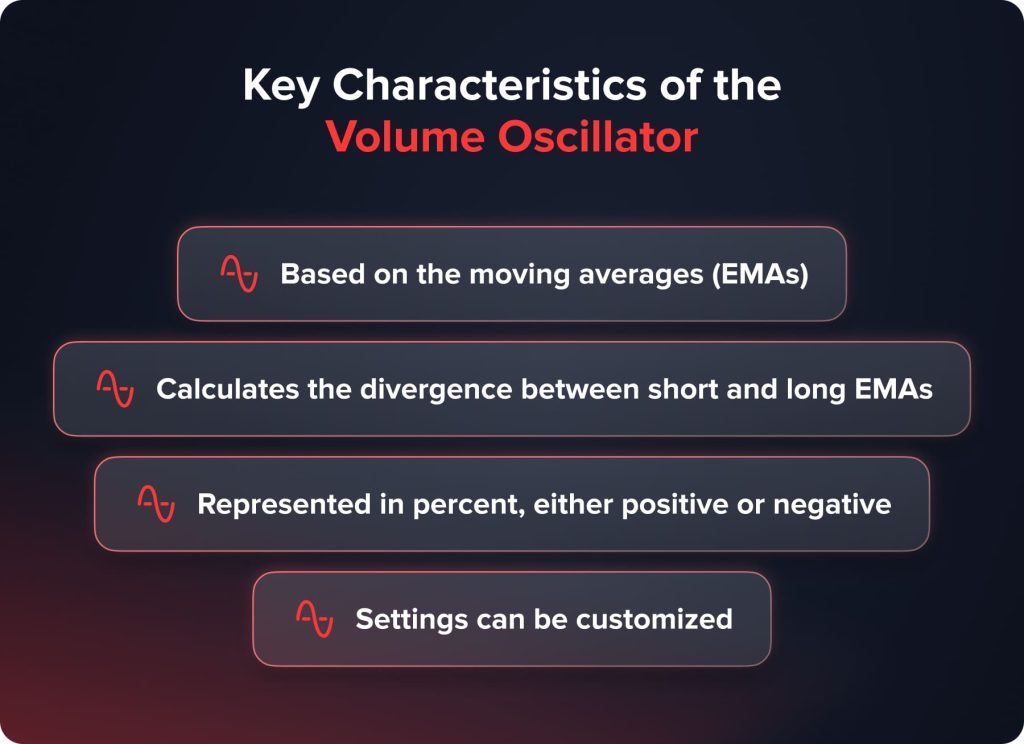
O objetivo principal do Oscilador de Volume é analisar os volumes de negociação do mercado e mostrar as interdependências entre eles e os movimentos de preços. O oscilador mede a diferença entre duas Médias Móveis e permite que os traders obtenham informações importantes e precisas sobre os movimentos do mercado.
O Oscilador de Volume é um instrumento de impulso que identifica as mudanças na pressão de compra e venda. O indicador define como os volumes de negociação se desviam das médias móveis. Os dados fornecidos ajudam os traders a entender a força de uma tendência atual ou a encontrar alguns pré-requisitos para uma reversão de tendência.
Ao analisar as informações fornecidas pelo Oscilador de Volume, os traders podem determinar a força de uma tendência. Se o instrumento estiver subindo, isso indica o aumento das tendências de alta. Uma linha descendente do indicador mostra a pressão de baixa.
Como funciona o oscilador?
Vamos adicionar o instrumento no gráfico para ilustrar a aparência do Oscilador de Volume.
Quando adicionamos o indicador ao gráfico, ele é exibido em uma janela separada, abaixo do gráfico principal. A ferramenta se parece com uma linha que se move acima ou abaixo do nível de 0%.
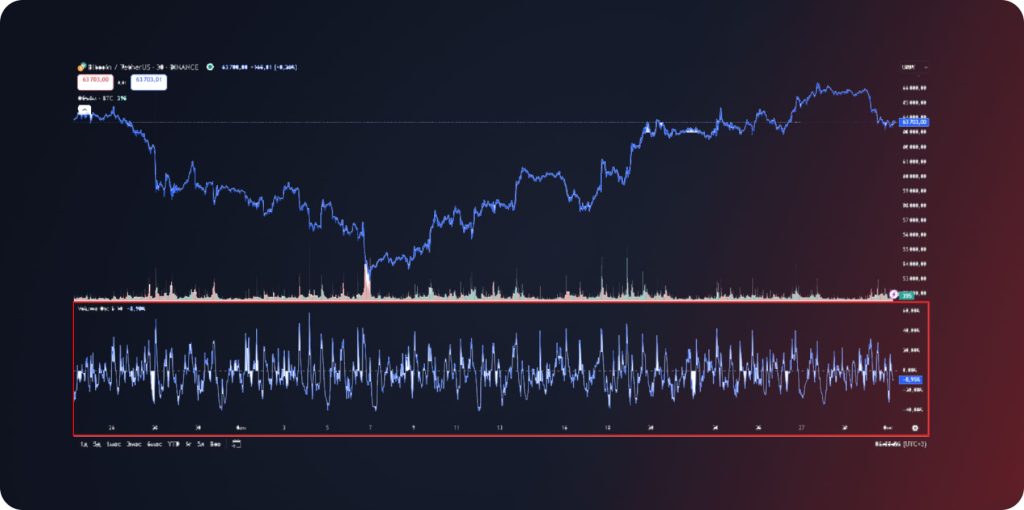
O valor do oscilador de volume é calculado de acordo com a fórmula:
Vol Osc = 100 * (EMA Curto – EMA Longo) / EMA Longo
- EMA curto – Média Móvel Exponencial com período mais curto aplicado aos volumes de negociação;
- Long EMA – Média Móvel Exponencial com um período mais longo aplicado aos volumes de negociação.
Ao falar sobre as configurações padrão, são utilizadas as EMA 5 (curta) e EMA 10 (longa), mas o trader pode alterar as configurações e construir o Oscilador de Volume para outros períodos, se necessário. Além disso, você pode alterar o período geral usado para o cálculo (de 1 tick para 12 meses).
Assim, entendemos a aparência do indicador e quais configurações os traders podem alterar ao usar o instrumento. Vamos nos aprofundar em como o Oscilador de Volume funciona.
Elementos-chave do indicador
O oscilador de volume consiste nos seguintes componentes:
- Médias Móveis Exponenciais de Curta e Longa. Os osciladores de volume comparam uma média móvel de curta a uma média móvel de longa. A comparação suaviza os dados e reduz os ruídos do mercado; por isso, os traders podem identificar tendências com mais facilidade.
- Níveis de sobrecompra e sobrevenda. O Oscilador de Volume e suas variações mostram os níveis em que um ativo está sobrecomprado ou sobrevendido. Esses níveis são marcadores de condições extremas de compra e venda e ajudam os traders a prever novas reversões de tendência. Quando a linha do oscilador atinge o nível de sobrecompra, indica que o mercado está pronto para uma correção de baixa, e vice-versa.
- Divergência. A divergência ocorre quando o preço de um ativo e a linha do oscilador se movem em direções opostas. Tal situação indica que a tendência atual se esgotou e o mercado está pronto para um movimento de reversão. Por exemplo, o preço de um ativo sobe, mas o Oscilador de Volume cai constantemente – a pressão de compra enfraquece e é hora de abrir posições vendidas.
A compreensão dos elementos mencionados acima é extremamente importante para traders que desejam utilizar o Oscilador de Volume em suas estratégias.
O princípio de funcionamento do oscilador de volume
O instrumento se baseia nas duas linhas da MME e calcula a diferença entre as médias móveis. O desvio mostra a convergência/divergência do volume de negociação ao longo do tempo.
- Quando uma EMA curta é maior que uma EMA longa, a linha do oscilador está se movendo dentro de uma "área positiva".
- Quando uma EMA longa é maior que uma EMA curta, a linha do oscilador está se movendo dentro de uma "área negativa".
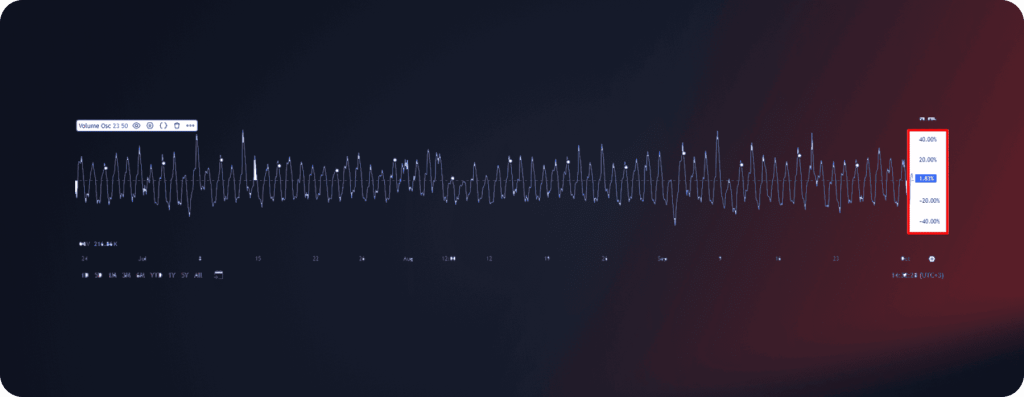
Como configurar as configurações do oscilador de volume?
Ao adicionar o instrumento ao gráfico, as configurações contêm principalmente os seguintes períodos: 5 para uma média móvel exponencial curta e 10 para uma média móvel exponencial longa. Traders profissionais alteram as configurações para tornar o indicador menos ruidoso. Eles alteram o período curto da MME para 23 e selecionam 50 para o período longo da MME.
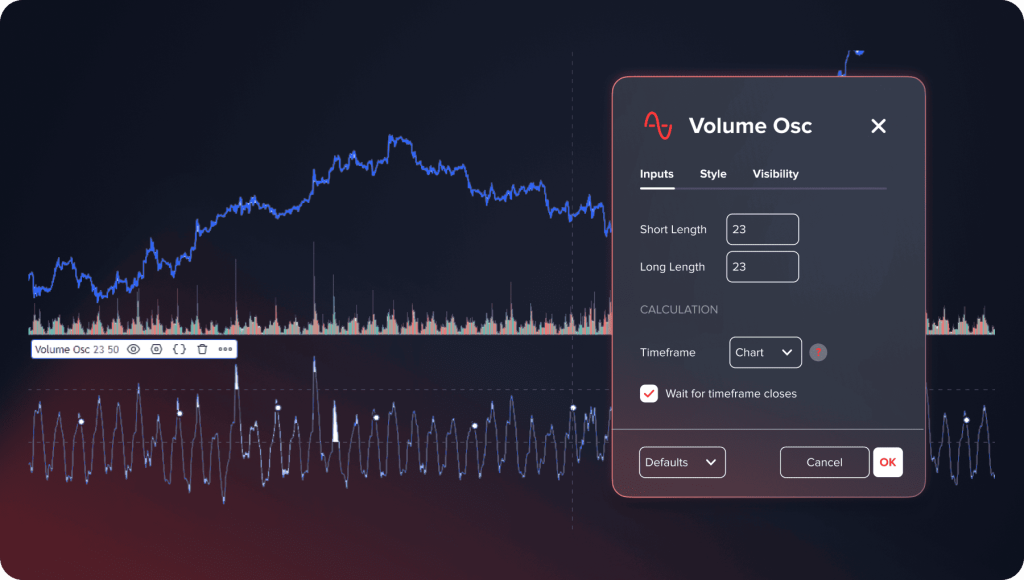
Quanto às cores e outras configurações gráficas, você pode utilizar quaisquer opções que desejar, pois elas não afetam a eficácia.
Sinais de negociação fornecidos pelo oscilador de volume
Traders profissionais consideram este indicador um dos instrumentos mais eficazes. Como usar tal instrumento na análise técnica? Existem alguns padrões que os traders levam em consideração:
- A divergência entre o movimento do preço de um ativo e o Oscilador de Volume. Quando um trader observa uma situação de mercado em que o preço de um ativo sobe e a linha do oscilador desce, isso indica uma alta probabilidade de reversão de tendência. Por exemplo, o preço do Bitcoin sobe quando o oscilador mostra o movimento oposto. Concluímos que a tendência atual se esgotou e o preço da criptomoeda vai cair.
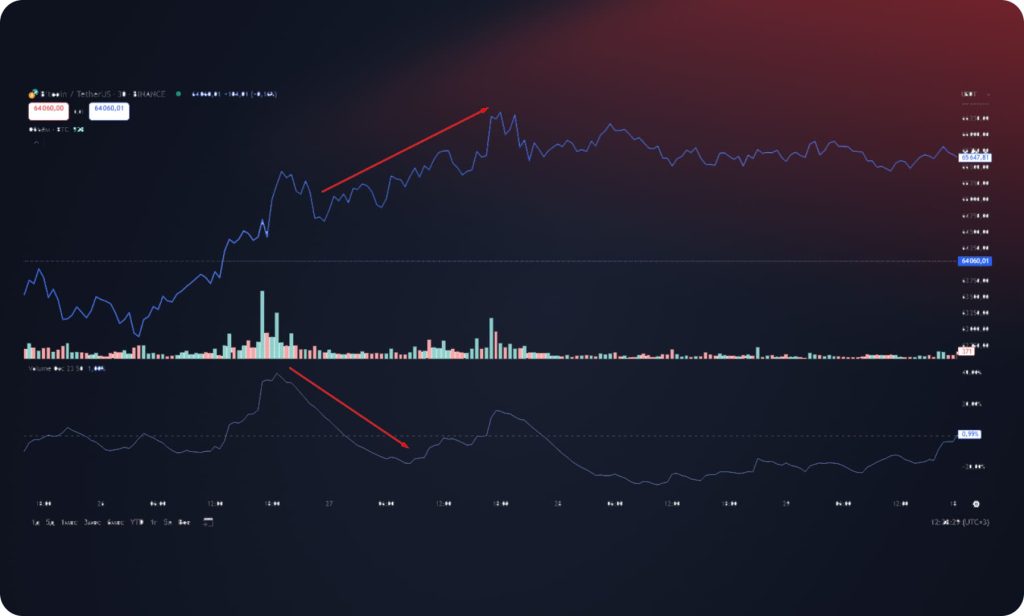
- A convergência entre o movimento do preço de um ativo e o Oscilador de Volume. Quando um trader observa o preço de um ativo subindo e a linha do oscilador se move na mesma direção, o mercado é caracterizado por uma tendência de alta bastante forte. Nessa situação, os traders abrem posições de acordo com a tendência.
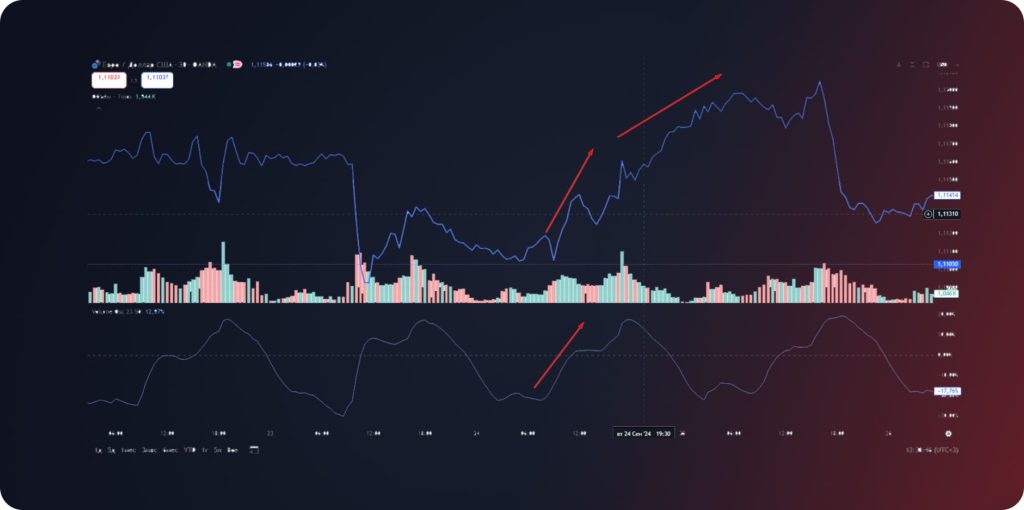
- Os níveis de sobrecompra e sobrevenda. Quando a linha do oscilador toca a área de sobrecompra ou sobrevenda, há uma alta probabilidade de que o preço se mova na direção oposta. No caso do oscilador de volume padrão, as áreas de sobrecompra e sobrevenda estão localizadas acima do nível de 40% e abaixo do nível de -40%.
Variações do oscilador de volume
O Oscilador de Volume é o instrumento básico usado para analisar volumes de atividade de negociação; entretanto, esta categoria contém outros instrumentos técnicos que se baseiam no mesmo princípio. Quais são os osciladores de volume mais comuns?
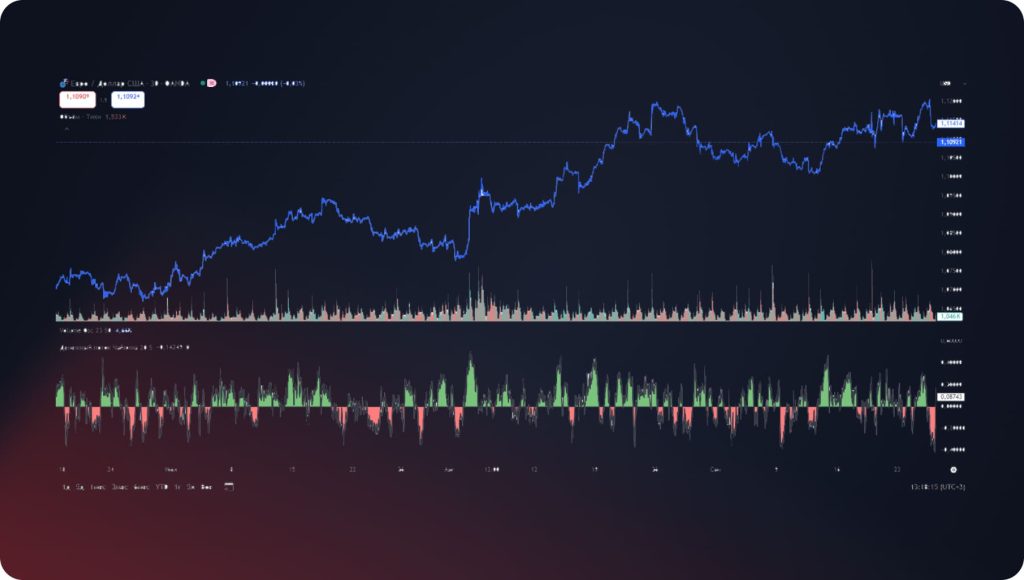
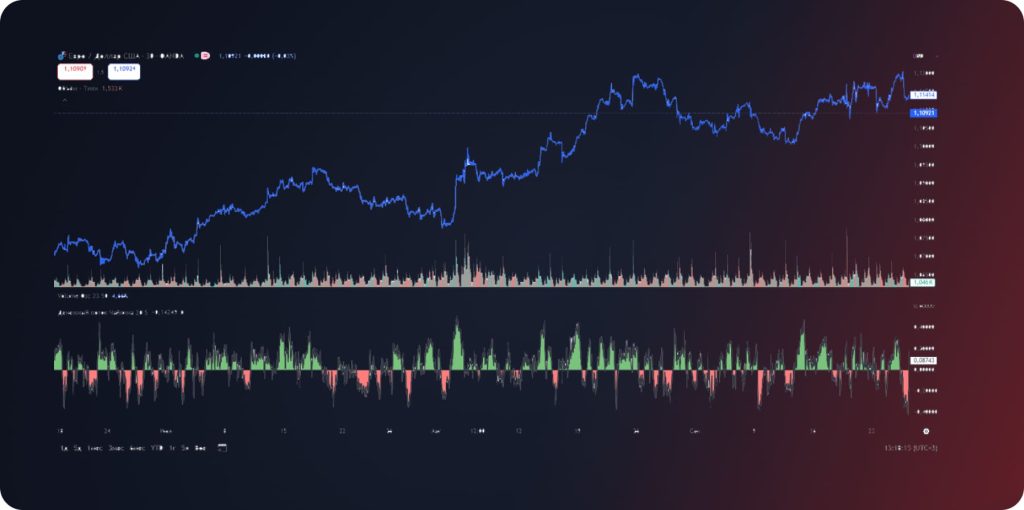
Fluxo de dinheiro de Chaikin
O indicador foi desenvolvido por Mark Chaikin, um renomado corretor e analista. Segundo sua teoria, as linhas de acumulação/distribuição que levam em consideração preço e volume revelam insights únicos sobre as tendências do mercado.
O CMF é baseado em dois componentes principais: o volume do fluxo de dinheiro e o multiplicador do fluxo de dinheiro. O volume do fluxo de dinheiro é calculado multiplicando o preço médio de um ativo pelo volume de negociação. O multiplicador do fluxo de dinheiro é calculado dependendo se o preço está subindo ou descendo.
O Chaikin Money Flow fornece aos traders os seguintes sinais:
- Se o CMF for positivo e continuar subindo, isso indica pressão de compra e a tendência de alta pode continuar.
- Se o CMF for negativo e continuar caindo, isso indica pressão de venda e a tendência de baixa pode continuar.
- Se o CMF se mover em torno de zero, o equilíbrio entre compradores e vendedores aparece, a tendência pode ser incerta.
Volume em equilíbrio
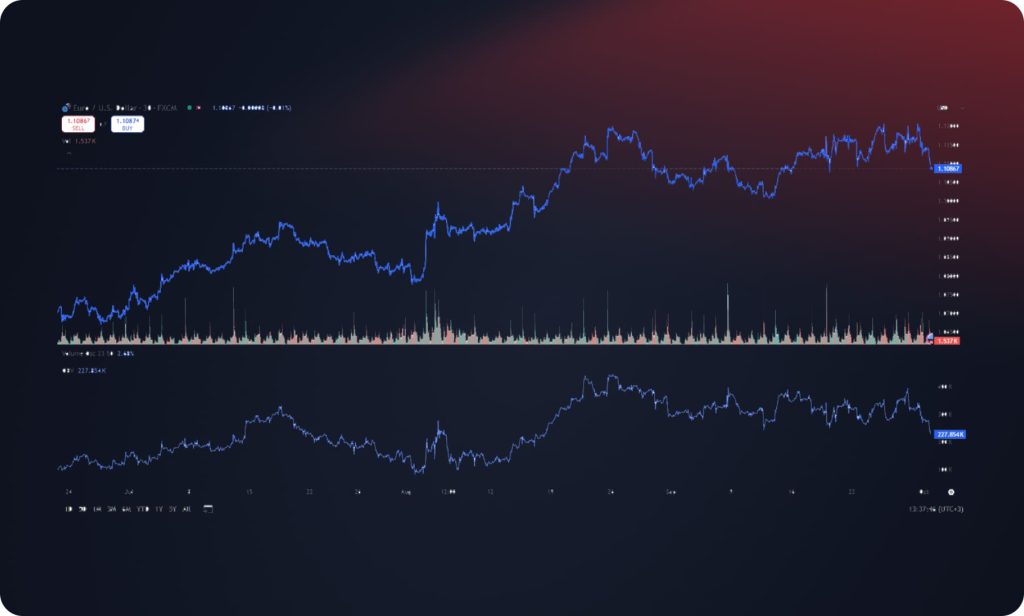
O indicador On Balance Volume calcula a interdependência entre variações de preço e de volume. O instrumento baseia-se na teoria de que movimentos significativos de preço sempre acompanham variações bruscas de volume. Por exemplo, quando grandes players começam a investir maciçamente em um ativo, seus volumes de negociação aumentam acentuadamente. Com o tempo, esses movimentos também afetam os preços do ativo.
O Volume de Saldo é exibido na parte inferior do gráfico. A linha sobe quando o preço sobe e desce quando cai. Um salto acentuado no indicador indica a participação de grandes players, e um aumento suave indica que o restante da multidão aderiu à negociação.
Aqui estão as principais características do instrumento:
- Calcula a interdependência entre movimentos de preços e movimentos de volume.
- Mostra o humor dos principais jogadores.
- Ajuda a prever futuros movimentos de preços.
Oscilador Klinger
O Oscilador Klinger é um indicador técnico baseado em volume usado para comparar volume com preço e prever reversões de preço. O instrumento foi introduzido por Stephan Klinger em 1977.
O indicador consiste em duas linhas, representando o KVO e a média móvel exponencial (MME). A MME é usada para determinar a média móvel de 13 períodos e é um indicador-chave para compra ou venda. O indicador mostra como os movimentos de volume afetam os níveis de preço.
O Oscilador Klinger ajuda a identificar sinais de compra e venda através das linhas da média móvel de 13 períodos. Nesse sentido, ele atua de forma semelhante ao indicador MACD. Se o Oscilador Klinger ultrapassar a linha de sinal, os traders podem mudar para posições de alta. Se o oscilador ficar abaixo da linha de sinal, isso indica um sentimento de baixa.
Prós e contras do oscilador de volume
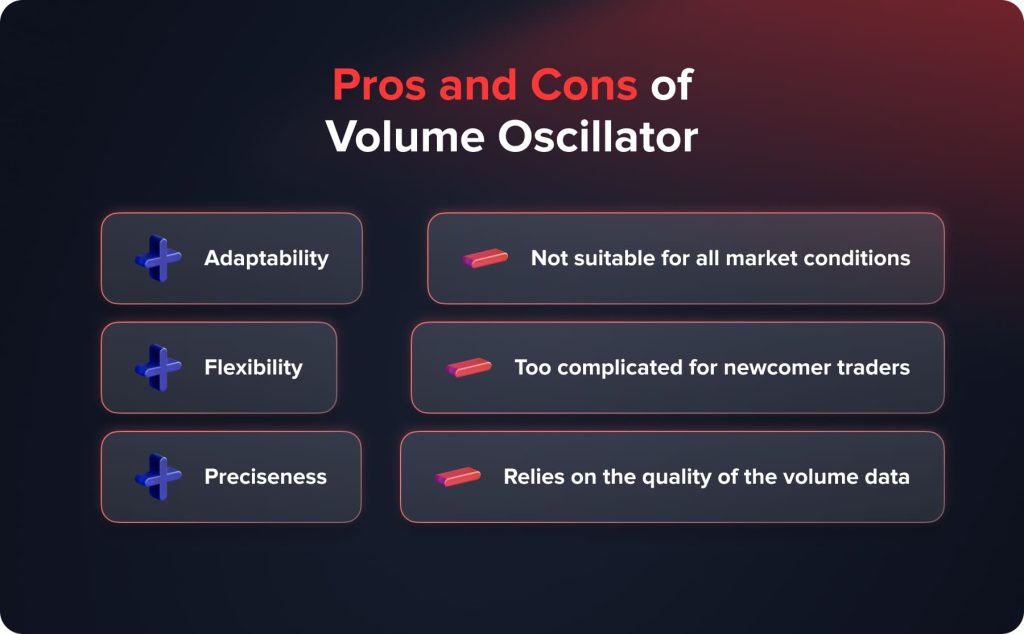
As principais vantagens do indicador são as seguintes:
- Adaptabilidade. O instrumento é eficaz em diferentes mercados financeiros e períodos. Os traders podem utilizar o Oscilador de Volume para ações, Forex, metais, criptomoedas e outros ativos.
- Flexibilidade. Os traders combinam facilmente osciladores de volume com outros instrumentos técnicos para obter sinais de negociação os mais precisos possíveis.
- Precisão. Em caso de configurações corretas, o Volume Oscillator fornece aos traders sinais de negociação precisos com ruídos de mercado mínimos.
Quanto aos riscos e limitações do instrumento, apontam-se os seguintes:
- O instrumento não é adequado para todas as condições de mercado.
- O Oscilador de Volume é muito complicado para traders iniciantes.
- O indicador depende da qualidade dos dados de volume; informações de preço não são levadas em consideração.
Estratégias de negociação baseadas no oscilador de volume
Aqui estão as estratégias de negociação mais difundidas que incluem o Oscilador de Volume:
- Negociando de acordo com a tendência. Ao observar a convergência entre o oscilador e o movimento do preço, abra posições de acordo com a tendência atual do mercado. Use os seguintes instrumentos adicionais para obter sinais mais precisos: Média Móvel, SAR Parabólico, etc.
- Negociação reversa. Abra posições opostas ao observar a divergência entre o oscilador e o movimento do preço. Para obter sinais mais precisos, conte com os seguintes instrumentos adicionais: RSI, Estocástico, etc.
- Negociação de rompimento. Quando o preço de um ativo rompe uma linha de suporte ou resistência, a expansão do volume no Oscilador de Volume comprova o sinal. Além disso, você pode combinar o indicador com Bandas de Bollinger, Canal de Keltner, Canal de Donchian e assim por diante.
Conclusão: O oscilador de volume é útil para traders?
O Oscilador de Volume se enquadra na categoria dos indicadores mais eficazes e úteis. Ele mostra a convergência e a divergência entre os movimentos de preço e de volume. Os dados fornecidos ajudam os traders a identificar a tendência atual, sua força e possíveis reversões. Além disso, o Oscilador de Volume indica níveis de sobrecompra e sobrevenda. Traders profissionais, por sua vez, não dependem desses instrumentos separadamente. Estratégias de negociação eficazes combinam o Oscilador de Volume com outros instrumentos comuns para obter sinais mais precisos.
Atualizado:
19 de dezembro de 2024