
The Volume Oscillator is a technical instrument that is used for analyzing the volumes of trading activity. Such an indicator determines the difference between two Moving Averages of volume. A graphical representation of the difference makes it possible for traders to identify patterns that indicate buying and selling pressure in the market.
Key takeaways:
- What does the Volume Oscillator mean?
- How does the oscillator work?
- Which formula is used to calculate the oscillator?
- Variations of the Volume Oscillator.
- How can traders combine the oscillator with other technical instruments?
- What are the most widespread strategies that include the Volume Oscillator?
- Pros and pitfalls of the Volume Oscillator.
What is the Volume Oscillator?
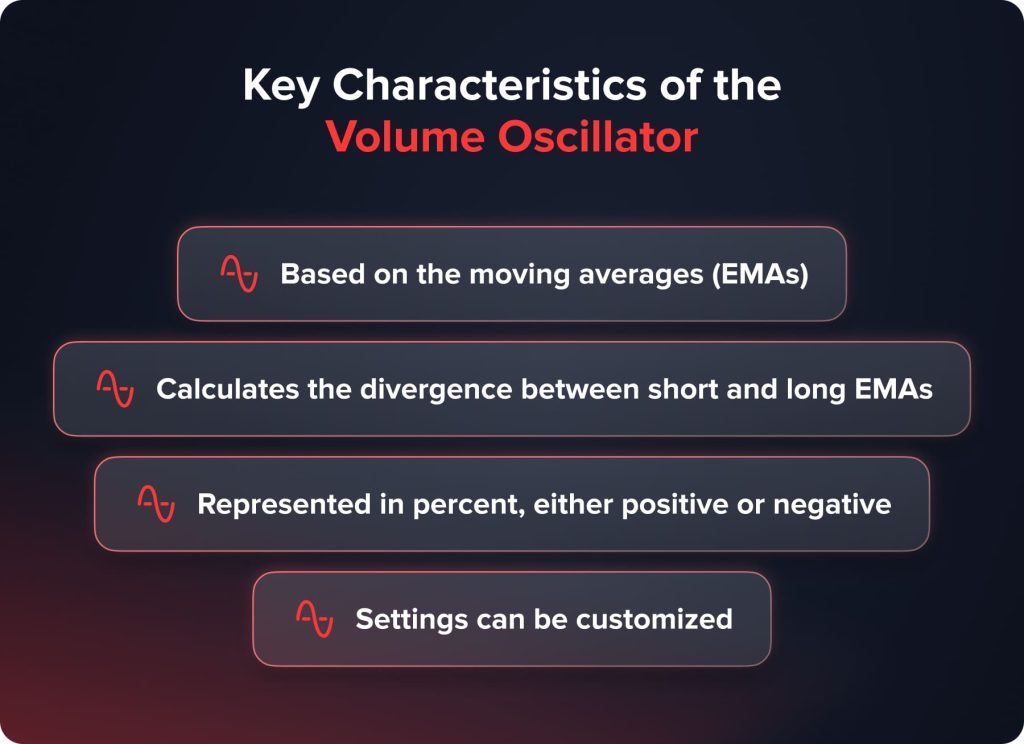
The core goal of the Volume Oscillator lies in analyzing market trading volumes and showing the interdependences between trading volumes and price movements. The oscillator measures the difference between two Moving Averages and lets traders get important and precise information on market movements.
The Volume Oscillator is an impulse instrument that identifies the changes in buying and selling pressure. The indicator defines how trading volumes deviate from moving averages. The given data helps traders understand the strength of a current trend or find some preconditions for a trend reversal.
When analyzing the information given by the Volume Oscillator, traders may determine a trend’s strength. If the instrument is rising, it indicates the increase of bullish tendencies. A falling line of the indicator shows the bearish pressure.
How Does the Oscillator Work?
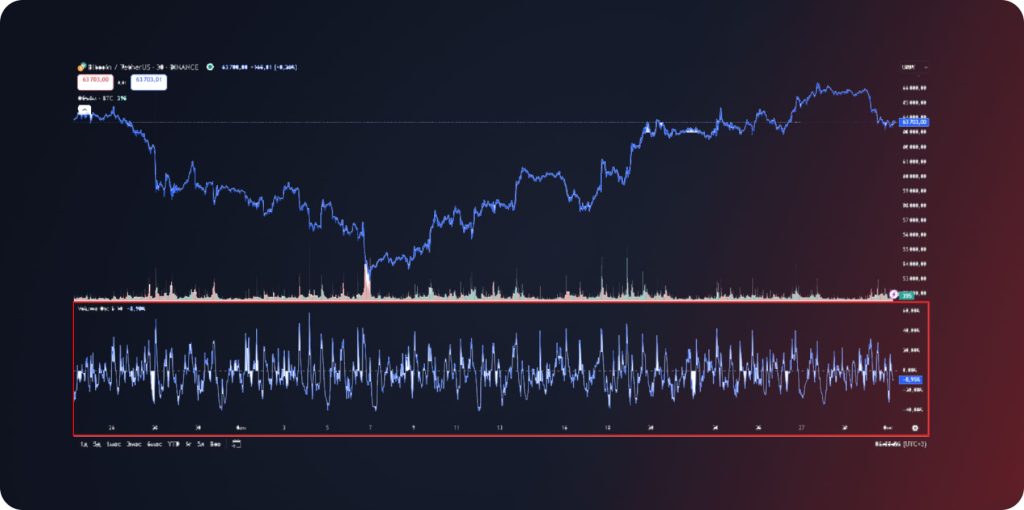
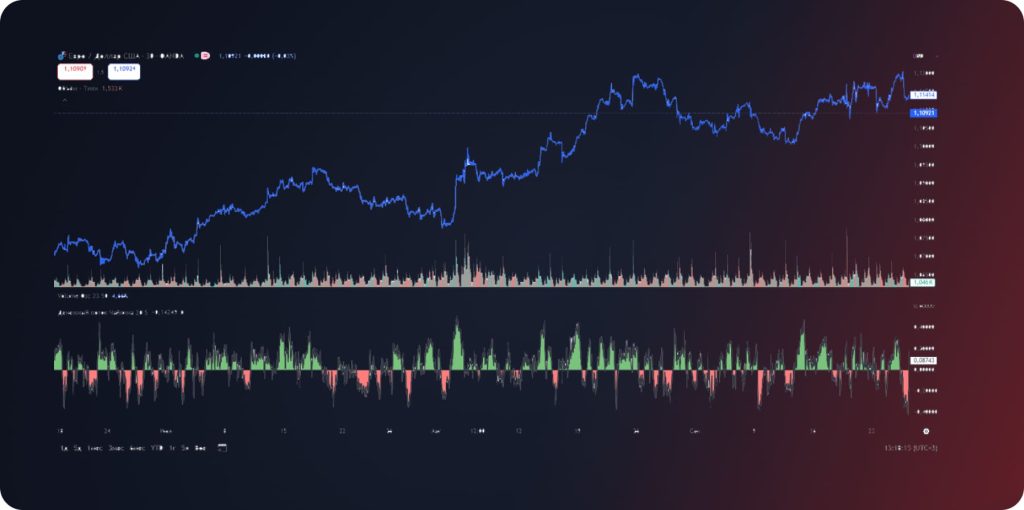
Let’s add the instrument on the chart to illustrate how the Volume Oscillator looks like.
When we add the indicator to the chart, it is displayed in a separate window, under the main chart. The tool looks like a line that moves above or below the 0% level.
The Volume Oscillator value is calculated according to the formula:
Vol Osc = 100 * (Short EMA – Long EMA) / Long EMA
- Short EMA – Exponential Moving Average with a shorter period applied to trading volumes;
- Long EMA – Exponential Moving Average with a longer period applied to trading volumes.
When talking about default settings EMA 5 (short) and EMA 10 (long) are used, but a trader may change the settings and build the Volume Oscillator for other periods if necessary. Furthermore, you may change the overall period that is used for calculation (from 1 tick to 12 months).
As such, we understand how the indicator looks like, and what are the settings traders may change when using the instrument. Let’s dive deeper in how the Volume Oscillator works.
Key Elements of the Indicator
Volume Oscillator consists of the following components:
- Short and long Exponential Moving Averages. Volume oscillators compare a short moving average to a long moving average. The comparison smooths the data and reduces market noises; which is why traders may easier identify trends.
- Overbought and oversold levels. The Volume Oscillator and its variations show the levels where an asset is either overbought or oversold. Those levels are the markers of extreme buying and selling conditions and help traders predict further trend reversals. When the oscillator’s line reaches the overbought level, it indicates that the market is ready for a downward correction, and vice versa.
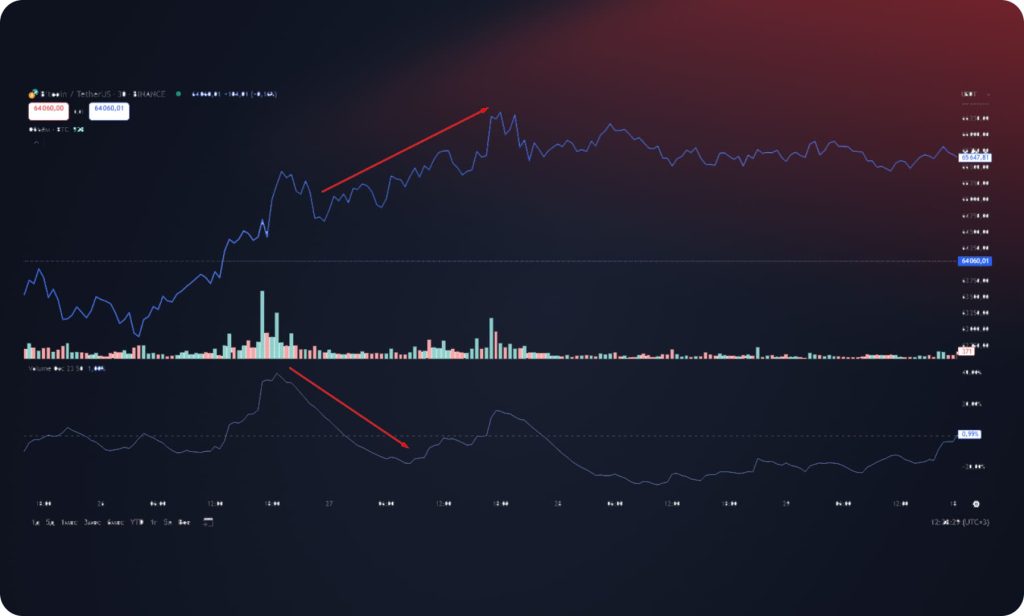
- Divergence. Divergence occurs when an asset’s price and the oscillator’s line moves in opposite directions. Such a situation shows that the current trend is exhausted and the market is ready for a reversal movement. For instance, an asset’s price moves higher, but the Volume Oscillator steadily decreases – the buying pressure weakens, and it’s high time to open short positions.
The understanding of the above mentioned elements is exceptionally important for traders who want to utilize the Volume Oscillator in their strategies.
The Working Principle of the Volume Oscillator
The instrument relies on the two EMA lines and calculates the difference between moving averages. The deviation shows the convergence/divergence of trading volume over time.
- When a short EMA is higher than a long EMA, the oscillator’s line is moving inside a ‘positive area.’
- When a long EMA is higher than a short EMA, the oscillator’s line is moving inside a ‘negative area.’
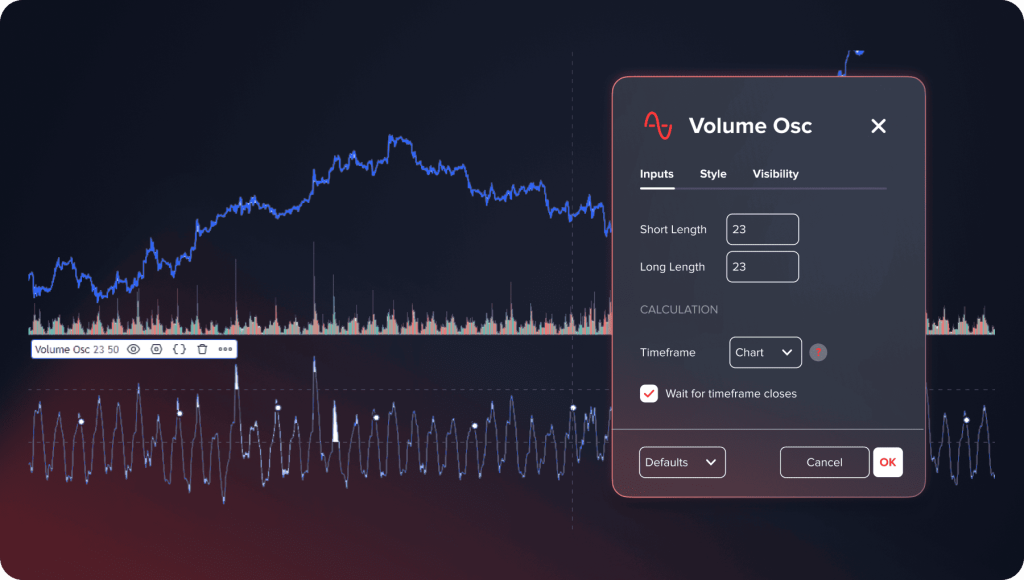
How to Configure the Settings of the Volume Oscillator?
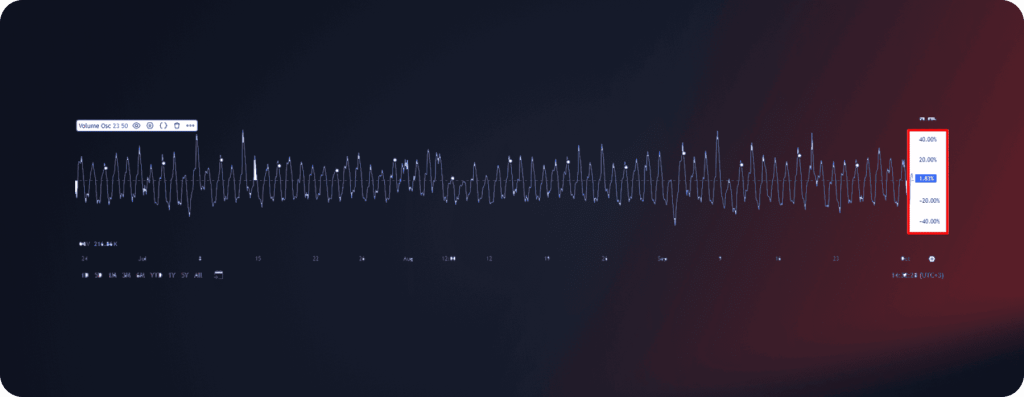
When adding the instrument to the chart, the settings mainly contain the following periods: 5 for a short exponential moving average, and 10 – for a long exponential moving average. Professional traders change the settings to make the indicator less noisy. They change the short EMA period to 23, and select 50 for the long EMA period.
As for the colors and other graphic settings, you may utilize any options you want, as those don’t affect the effectiveness.
Trading Signals Given by the Volume Oscillator
Professional traders understand this indicator among the most effective instruments. How to use such an instrument in technical analysis? There are some patterns traders take into account:
- The divergence between an asset’s price movement and the Volume Oscillator. When a trader finds the market situation when an asset’s price moves higher, and the oscillator’s line moves lower, it indicates a high probability of a trend reversal. For instance, the Bitcoin price increases when the oscillator shows the opposite movement. We make a conclusion that the current trend is exhausted, and the cryptocurrency’s price is going to move downwards.
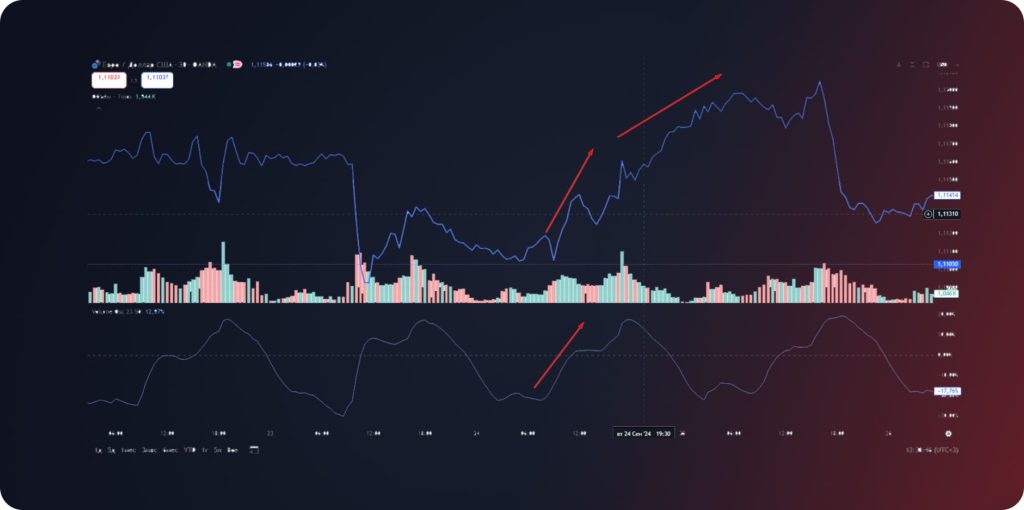
- The convergence between an asset’s price movement and the Volume Oscillator. When a trader observes an asset’s price moving higher and the oscillator’s line is moving in the same direction, the market is characterized by a rather strong bullish trend. In such a situation, traders open positions according to a trend.
- The overbought and oversold levels. When the oscillator’s line touches either the overbought or oversold area, there is a high probability that the price will go in the opposite direction further. When talking about the standard type of the Volume Oscillator, the overbought and oversold areas are located higher than 40% and lower than -40% level.
Variations of Volume Oscillator
The Volume Oscillator is the basic instrument used for analyzing volumes of trading activity; meanwhile, this category contains other technical instruments that are based on the same principle. What are the most widespread volume oscillators?
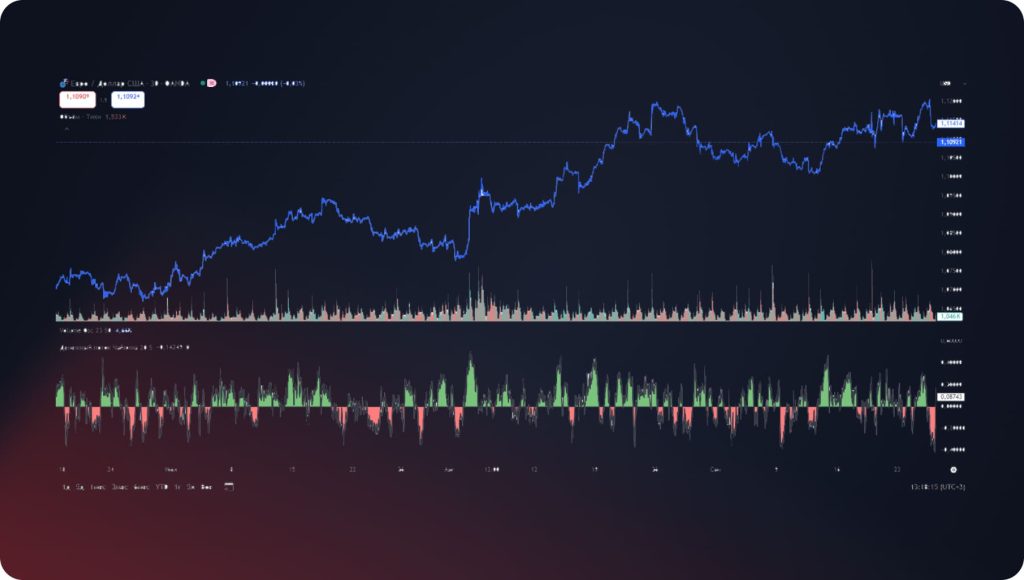
Chaikin Money Flow
The indicator was developed by Mark Chaikin, a well-known broker and analyst. According to his theory, the accumulation/distribution lines that take into account both price and volume unlocks unique insights into market trends.
The CMF is based on two key components – the money flow volume and the money flow multiplier. The money flow volume is calculated by multiplying the average price of an asset by the trading volume. The money flow multiplier is calculated depending on whether the price is moving up or down.
Chaikin Money Flow provides traders with the following signals:
- If the CMF is positive and continues rising, it indicates buying pressure and the uptrend may continue.
- If the CMF is negative and continues falling, it indicates selling pressure and the downtrend may continue.
- If CMF moves around zero, the balance between buyers and sellers appears, the trend may be uncertain.
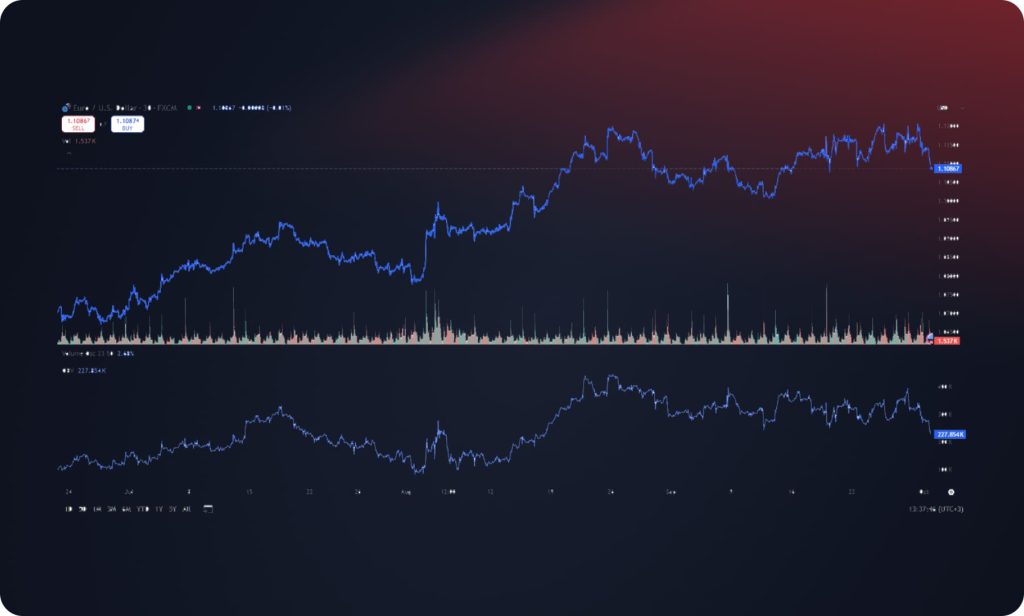
On-Balance Volume
On Balance Volume indicator calculates the interdependence between price changes and volume changes. The instrument relies on the theory according to which significant price movements always accompany sharp volume changes. For instance, when major players start massively investing in an asset, its trading volumes sharply grow. Over time these movements affect an asset’s prices as well.
On Balance Volume is displayed at the bottom of the chart. The line rises higher when the price rises and goes down when it falls. A sharp jump in the indicator shows the participation of large players, and a smooth increase indicates that the rest of the crowd has joined the trade.
Here are the main characteristics of the instrument:
- Calculates the interdependence between price movements and volume movements.
- Shows the mood of major players.
- Helps predict further price movements.
Klinger Oscillator
The Klinger Oscillator is a volume-based technical indicator that is used to compare volume with price to predict price reversals. The instrument was introduced by Stephan Klinger in 1977.
The indicator consists of two lines, representing the KVO and the exponential moving average (EMA). The EMA is used to determine the 13-period moving average and is a key indicator for buying or selling. The indicator shows how the volume movements affect price levels.
The Klinger Oscillator helps identify buy and sell signals through the 13-period moving average lines. In this regard, it acts similarly to the MACD indicator. If the Klinger Oscillator goes beyond the signal line, traders can switch to bullish positions. If the oscillator goes below the signal line, it indicates bearish sentiment.
Pros and Cons of Volume Oscillator
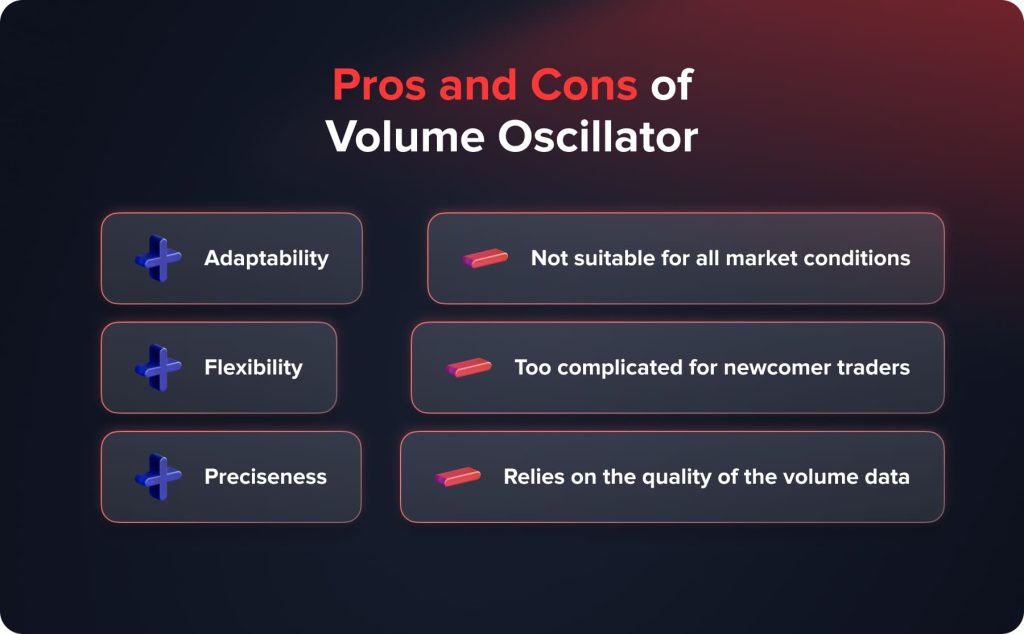
The main advantages of the indicator are as follows:
- Adaptability. The instrument is effective on different financial markets and timeframes. Traders may utilize Volume Oscillator for stocks, Forex, metals, cryptocurrencies, and other assets.
- Flexibility. Traders easily combine volume oscillators with other technical instruments to get as precise trading signals as possible.
- Preciseness. In case of correct configurations Volume Oscillator provides traders with precise trading signals with minimum market noises.
As for the risks and limitations of the instrument, the following ones are pointed out:
- The instrument is not suitable for all market conditions.
- Volume Oscillator is too complicated for newcomer traders.
- The indicator relies on the quality of the volume data, price information is not taken into account.
Trading Strategies Based on Volume Oscillator
Here are the most widespread trading strategies that include Volume Oscillator:
- Trading according to the trend. When you see the convergence between the oscillator and the price movement, open positions according to the current market trend. Use the following additional instruments to get more precise signals: Moving Average, Parabolic SAR, etc.
- Reversal trading. Open the opposite positions when you observe the divergence between the oscillator and the price movement. To get more precise signals rely on the following additional instruments: RSI, Stochastic, etc.
- Breakout trading. When an asset’s price breaks a support or resistance line, the volume expansion on Volume Oscillator proves the signal. Furthermore, you may combine the indicator with Bollinger Bands, Keltner Channel, Donchian Channel, and so on.
Bottom Line: Is Volume Oscillator Useful for Traders?
Volume Oscillator falls into the category of the most effective and useful indicators. It shows the convergence and divergence between price movements and volume movements. The given data helps traders identify the current trend, its strength, and possible reversals. Furthermore, Volume Oscillator indicates overbought and oversold levels. Meanwhile, professional traders do not rely on these instruments separately. Effective trading strategies combine Volume Oscillator with other widespread instruments to get more precise signals.

