
Markets move on numbers.
But they turn on emotions.
Fear pushes people to protect themselves.
Greed makes them chase upside.
The Put-Call Ratio, or PCR, sits right at that emotional crossroads. It doesn’t care about earnings, balance sheets, or GDP. It simply watches what traders are doing with options and translates that behavior into a single number.
At its core, the PCR compares how many put options are being traded versus call options.
- Puts = bets on prices falling, or insurance against a drop
- Calls = bets on prices rising
When fear dominates, puts pile up.
When optimism runs hot, calls take over.
That’s it. Simple idea. Powerful signal.
But the real value of the PCR isn’t in what most people think it says. It shines when you read it against the crowd.
This guide walks through how the Put-Call Ratio actually works in the real world. Not theory. Not buzzwords. Just how traders use it, misuse it, and sometimes get burned by it.
Why Sentiment Matters More Than Most People Admit
Plenty of smart investors ignore sentiment indicators.
They prefer fundamentals. Or technical patterns.
That’s understandable.
But here’s the thing: price moves when expectations change, not when facts are published.
By the time bad news hits the headlines, fear has often already done its damage.
By the time everyone feels confident, much of the upside is already gone.
The PCR gives you a snapshot of expectations before price reacts.
Not always.
Not perfectly.
But often enough to matter.
What exactly is the Put-Call Ratio?
The Put-Call Ratio measures the relationship between put option volume and call option volume.
In plain language, it answers one question:
Are traders leaning more toward protection and downside bets, or upside speculation?
To understand it, you need the two basic building blocks.
Calls
A call option gives the buyer the right to buy a stock at a certain price.
People buy calls when they expect prices to rise.
Sometimes they speculate.
Sometimes they replace stock exposure with less capital.
Either way, calls lean bullish.
Puts
A put option gives the buyer the right to sell a stock at a certain price.
Puts are bought for two reasons:
- To profit from a decline
- To hedge an existing position
Both increase put volume.
But not all put buying equals panic. We’ll come back to that.
PCR as a mood thermometer
Once you aggregate all those puts and calls, you get a ratio.
That ratio doesn’t predict direction on its own.
It measures pressure.
- High PCR → fear, protection, caution
- Low PCR → confidence, speculation, risk-taking
Think of it as crowd psychology, not a trading signal by itself.
How the Put-Call Ratio is Calculated
Most traders never calculate the PCR manually. Platforms show it automatically.
Still, it helps to understand the math.
That’s all.
A simple example
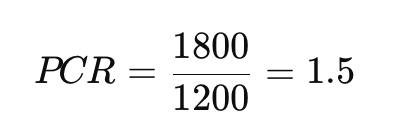
Let’s say you’re looking at options activity on the S&P 500 ETF.
- 1,800 put contracts traded today
- 1,200 call contracts traded today
That means traders bought 1.5 puts for every call.
Fear is clearly in the driver’s seat.
Why the PCR is a Contrarian Indicator
This is where most beginners get confused.
Intuitively, you might think:
“If everyone is bearish, prices must fall.”
Markets rarely work that way.
When too many people agree on one outcome, the trade is crowded.
Crowded trades tend to break when there’s no one left to join them.
The PCR flips the logic:
- Extreme fear often appears near market bottoms
- Extreme optimism often shows up near market tops
Not because people are wrong individually.
But because everyone has already acted.
Reading PCR Levels the Right Way
The exact numbers vary by market and instrument.
But the general ranges are well-established.
High PCR (above ~1.0): fear dominates
When the ratio climbs above 1.0, puts outnumber calls.
What this usually means:
- Traders are hedging aggressively
- Downside protection is in demand
- News flow feels uncomfortable
From a contrarian view, this is often constructive, not bearish.
It suggests:
- Many sellers already sold
- Protection is already bought
- Selling pressure may be close to exhaustion
This is where markets often stabilize or bounce.
Low PCR (below ~0.7): optimism runs hot
A low ratio means calls overwhelm puts.
That usually signals:
- Confidence
- Speculation
- “This time is different” thinking
Contrarian logic sees risk here.
Not because the market must crash.
But because expectations are stretched.
Even a small disappointment can trigger a pullback.
Middle range (roughly 0.7–1.0): normal conditions
When the PCR sits in the middle, sentiment is balanced.
Nothing extreme.
Nothing urgent.
In this zone, price action and trend matter far more than sentiment.
Quick Reference: How to Interpret the PCR
| PCR level | Crowd mood | Contrarian read | What to watch for |
| Above 1.0 | Fear, protection | Bullish bias | Bottoms, rebounds |
| 0.7 – 1.0 | Neutral | No signal | Trend continuation |
| Below 0.7 | Greed, speculation | Bearish bias | Tops, pullbacks |
These are guidelines, not laws.
Context always matters.
Volume vs Open Interest: a Critical Distinction
You’ll often see two versions of the PCR.
They are not interchangeable.
PCR Based on Volume
This version uses today’s traded contracts.
It reflects:
- Short-term emotion
- News reactions
- Fast shifts in sentiment
Best for:
- Day traders
- Short-term swing traders
It’s noisy, but honest.
PCR Based on Open Interest
This version uses all open contracts that still exist.
It reflects:
- Longer-term positioning
- Institutional exposure
- Structural hedging
Best for:
- Investors
- Macro analysis
Open interest moves slower.
But it often shows where big money is quietly leaning.
Which One Should You Use?
If you’re just starting out, stick with volume-based PCR.
It’s easier to read.
It reacts faster.
And it teaches you how sentiment behaves around turning points.
Expert insight #1: hedging distorts the signal
Here’s something that doesn’t show up in textbooks.
On broad indices like the S&P 500, a lot of put buying has nothing to do with bearish bets.
Large funds buy puts as insurance.
They do it systematically.
They do it regardless of outlook.
That means index PCRs naturally run higher than stock-level PCRs.
A PCR of 1.1 might be extreme for an individual stock like Apple.
For an index, it can be normal.
This is why experienced traders compare PCR readings to their own historical range, not a fixed number.
Common Mistakes Traders Make With PCR
Even solid indicators fail when used poorly.
Here are the biggest traps.
Treating PCR as a Buy or Sell Button
The PCR is not a trigger.
It’s a context tool.
A high reading doesn’t mean “buy now.”
A low reading doesn’t mean “sell now.”
It means: Pay attention. Something is stretched.
Ignoring Price Confirmation
Sentiment can stay extreme longer than you expect.
Markets can stay greedy for weeks.
They can stay fearful for days.
Smart traders wait for:
- Support or resistance levels
- Reversal candles
- Momentum shifts
PCR sets the stage.
Price delivers the verdict.
Forgetting Time Horizons
Short-term fear doesn’t always matter to long-term investors.
A daily PCR spike might mean nothing to someone holding for years.
Likewise, long-term positioning may not help a day trader.
Match the indicator to your timeframe.
Expert insight #2: PCR works best at emotional extremes
In real trading, the PCR is useless most of the time. And that’s okay.
Its value appears when:
- Headlines feel dramatic
- Social media is loud
- Traders feel certain
Those moments are rare.
That’s why they matter.
Many professionals ignore the PCR until it reaches levels that feel uncomfortable. Then they lean in, slow down, and look for confirmation.
Where to Find Reliable PCR Data
You don’t need expensive tools.
Good free sources exist.
- CBOE – the original source for index and equity PCR data
- TradingView – great for visual overlays and historical context
- Investopedia – solid explanations and background
If you can see the ratio plotted next to price, you’re already ahead of most traders.
Does PCR Work on Individual Stocks?
Yes. But with caveats.
Stock-level PCRs are volatile.
Earnings, news, and single trades can skew them.
They work best:
- On liquid stocks
- With steady options activity
- Away from major events
For most traders, PCR is more reliable on indices like the S&P 500 or NASDAQ.
Can the Put-Call Ratio Predict Crashes?
No. And it doesn’t try to.
It reflects sentiment, not causes.
During crashes, the PCR usually spikes after fear hits.
Before corrections, it often stays low for a long time.
Think of it as a warning light, not a crystal ball.
Why the PCR Sometimes Spikes Above 1.5 or Even 2.0
This usually happens when:
- Volatility surges
- Protection becomes urgent
- Liquidity dries up
Those readings are rare.
When they appear, markets are already under stress.
Historically, these extremes often align with panic lows.
But timing is never precise.
Is PCR Leading or Lagging?
It’s considered a contrarian leading indicator.
It doesn’t wait for price to turn.
It hints when conditions are ripe for a turn.
That makes it powerful.
And dangerous if used alone.
Final Thoughts: How to Actually Use the PCR
The Put-Call Ratio won’t make you rich on its own.
What it will do:
- Keep you grounded when emotions run hot
- Help you avoid chasing crowded trades
- Encourage patience at extremes
Use it as a filter.
Use it as a warning.
Use it as a reminder that markets are human systems first, mathematical systems second.
When everyone feels the same way, something usually breaks.
The PCR helps you notice that moment.

