
Thị trường di chuyển dựa trên con số.
Nhưng chúng xoay quanh cảm xúc.
Nỗi sợ khiến con người bảo vệ bản thân.
Tham lam làm họ đuổi theo lợi ích.
Tỷ lệ Put-Call, hay PCR, đứng ngay tại ngã ba cảm xúc đó. Nó không quan tâm đến lợi nhuận, bảng cân đối, hay GDP. Nó chỉ đơn giản theo dõi những gì các nhà giao dịch đang làm với quyền chọn và dịch chuyển hành vi đó thành một con số duy nhất.
Về cơ bản, PCR so sánh số lượng quyền chọn bán đang được giao dịch so với quyền chọn mua.
- Puts = cược vào việc giá sẽ giảm, hoặc bảo hiểm chống lại sự giảm giá
- Cuộc gọi = đặt cược vào việc giá tăng
Khi nỗi sợ chi phối, áp lực chồng chất.
Khi sự lạc quan lên cao, mọi thứ trở nên tốt đẹp.
Đó là tất cả. Ý tưởng đơn giản. Tín hiệu mạnh mẽ.
Nhưng giá trị thực sự của PCR không nằm ở những gì hầu hết mọi người nghĩ rằng nó nói. Nó tỏa sáng khi bạn đọc nó so với đám đông.
Hướng dẫn này sẽ đi qua cách mà Tỷ lệ Put-Call thực sự hoạt động trong thế giới thực. Không phải lý thuyết. Không phải từ ngữ mốt. Chỉ là cách các nhà giao dịch sử dụng, lạm dụng nó, và đôi khi bị thiệt hại vì nó.
Tại sao cảm xúc quan trọng hơn những gì hầu hết mọi người thừa nhận
Nhiều nhà đầu tư thông minh bỏ qua các chỉ báo tâm lý.
Họ thích các yếu tố cơ bản. Hoặc các mô hình kỹ thuật.
Điều đó có thể hiểu được.
Nhưng đây là điều quan trọng: giá cả di chuyển khi kỳ vọng thay đổi, chứ không phải khi sự thật được công bố.
Khi tin xấu xuất hiện trên các tiêu đề, nỗi sợ đã thường gây ra thiệt hại.
Khi mọi người cảm thấy tự tin, phần lớn lợi ích đã biến mất.
Phân tích PCR cung cấp cho bạn một bức tranh về kỳ vọng trước khi giá phản ứng.
Không phải lúc nào cũng vậy.
Không hoàn hảo.
Nhưng thường xuyên đủ để có ý nghĩa.
Tỷ lệ Put-Call là gì?
Tỷ lệ Put-Call đo lường mối quan hệ giữa khối lượng tùy chọn bán và khối lượng tùy chọn mua.
Bằng ngôn ngữ đơn giản, nó trả lời một câu hỏi:
Các nhà giao dịch đang nghiêng về việc bảo vệ và đặt cược vào sự giảm giá hơn, hay đầu cơ tăng giá?
Để hiểu điều đó, bạn cần hai khối xây dựng cơ bản.
Cuộc gọi
Một quyền chọn mua cho phép người mua quyền mua cổ phiếu với một mức giá nhất định.
Người ta mua quyền chọn mua khi họ dự đoán giá sẽ tăng.
Đôi khi họ đầu cơ.
Đôi khi họ thay thế mức độ tiếp xúc với cổ phiếu bằng ít vốn hơn.
Dù sao đi nữa, các cuộc gọi có xu hướng tăng giá.
Puts
Một quyền chọn bán cho phép người mua quyền bán một cổ phiếu ở một mức giá nhất định.
Các quyền chọn bán được mua vì hai lý do:
- Để kiếm lợi từ sự giảm giá
- Để phòng ngừa một vị trí hiện có
Cả hai đều tăng khối lượng đặt hàng.
Nhưng không phải tất cả việc mua vào đều đồng nghĩa với sự hoảng loạn. Chúng ta sẽ trở lại với điều đó.
PCR như một nhiệt kế tâm trạng
Khi bạn tổng hợp tất cả các lệnh bán và lệnh mua, bạn sẽ có được một tỷ lệ.
Tỷ lệ đó không tự dự đoán được hướng đi.
Nó đo áp lực.
- High PCR → sợ hãi, bảo vệ, thận trọng
- Thấp PCR → sự tự tin, suy đoán, chấp nhận rủi ro
Hãy coi đó như tâm lý đám đông, chứ không phải là tín hiệu giao dịch tự nó.
Cách Tính Tỷ Lệ Put-Call
Hầu hết các nhà giao dịch không bao giờ tính toán PCR bằng tay. Các nền tảng hiển thị nó tự động.
Vẫn vậy, điều đó giúp hiểu rõ về toán học.
Chỉ có vậy thôi.
Một ví dụ đơn giản
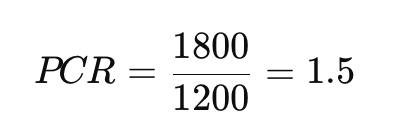
Giả sử bạn đang xem hoạt động quyền chọn trên ETF S&P 500.
- 1.800 hợp đồng put đã được giao dịch hôm nay
- 1,200 hợp đồng gọi đã được giao dịch hôm nay
Điều đó có nghĩa là các nhà giao dịch đã mua 1,5 hợp đồng quyền chọn bán cho mỗi hợp đồng quyền chọn mua.
Sự sợ hãi rõ ràng đang nắm quyền điều khiển.
Tại sao PCR là một chỉ báo ngược dòng
Đây là nơi hầu hết người mới bắt đầu bị nhầm lẫn.
Theo trực giác, bạn có thể nghĩ rằng:
“Nếu mọi người đều bi quan, giá cả chắc chắn sẽ giảm.”
Các thị trường hiếm khi hoạt động theo cách đó.
Khi quá nhiều người đồng ý về một kết quả, giao dịch trở nên đông đúc.
Các giao dịch đông đúc có xu hướng bị phá vỡ khi không còn ai tham gia vào chúng.
PCR thay đổi logic:
- Nỗi sợ hãi tột độ thường xuất hiện gần đáy thị trường
- Chủ nghĩa lạc quan cực đoan thường xuất hiện gần đỉnh thị trường
Không phải vì mọi người sai lầm một cách cá nhân.
Nhưng vì mọi người đã hành động.
Đọc mức PCR đúng cách
Các con số chính xác thay đổi theo thị trường và công cụ.
Tuy nhiên, các khoảng chung đã được xác định rõ ràng.
PCR cao (trên ~1.0): nỗi sợ chiếm ưu thế
Khi tỷ lệ vượt qua 1.0, số lệnh bán nhiều hơn số lệnh mua.
Điều này thường có nghĩa là:
- Các nhà giao dịch đang phòng ngừa một cách mạnh mẽ
- Bảo vệ downside đang được yêu cầu
- Luồng tin tức cảm thấy không thoải mái
Từ góc nhìn trái chiều, điều này thường mang tính xây dựng, không phải là tiêu cực.
Nó gợi ý:
- Nhiều người bán đã bán
- Bảo vệ đã được mua
- Áp lực bán có thể gần đến mức cạn kiệt
Đây là nơi mà các thị trường thường ổn định hoặc phục hồi.
PCR thấp (dưới ~0.7): sự lạc quan gia tăng
Tỷ lệ thấp có nghĩa là các cuộc gọi áp đảo các lệnh đặt.
Điều đó thường báo hiệu:
- Độ tự tin
- Sự suy đoán
- Suy nghĩ “Lần này thì khác”
Logic ngược lại thấy rủi ro ở đây.
Không phải vì thị trường phải sụp đổ.
Mà vì những kỳ vọng đang bị kéo dài.
Ngay cả một sự thất vọng nhỏ cũng có thể kích hoạt một đợt giảm giá.
Phạm vi trung bình (khoảng 0.7–1.0): điều kiện bình thường
Khi PCR nằm ở giữa, tâm trạng được cân bằng.
Không có gì cực đoan.
Không có gì khẩn cấp.
Trong khu vực này, hành động giá và xu hướng quan trọng hơn nhiều so với tâm lý.
Tài liệu tham khảo nhanh: Cách diễn giải PCR
| Cấp độ PCR | Tâm trạng đám đông | Đọc ngược | Những gì cần theo dõi |
| Trên 1.0 | Sợ hãi, bảo vệ | Thiên về tích cực | Đáy, phục hồi |
| 0.7 – 1.0 | Trung lập | Không có tín hiệu | Tiếp tục xu hướng |
| Dưới 0.7 | Tham lam, đầu cơ | Thiên về tiêu cực | Đỉnh, điều chỉnh |
Đây là hướng dẫn, không phải là luật.
Ngữ cảnh luôn quan trọng.
Khối lượng so với Lãi suất mở: một sự phân biệt quan trọng
Bạn sẽ thường thấy hai phiên bản của PCR.
Chúng không thể hoán đổi cho nhau.
PCR Dựa trên Thể tích
Phiên bản này sử dụng các hợp đồng được giao dịch hôm nay.
Nó phản ánh:
- Cảm xúc ngắn hạn
- Phản ứng tin tức
- Các thay đổi nhanh chóng trong cảm xúc
Người tốt nhất cho:
- Nhà giao dịch trong ngày
- Nhà giao dịch lướt sóng ngắn hạn
Nó ồn ào, nhưng trung thực.
PCR Dựa trên Lợi ích Mở
Phiên bản này sử dụng tất cả các hợp đồng mở vẫn còn tồn tại.
Nó phản ánh:
- Định vị dài hạn
- Tiếp cận thể chế
- Bảo hiểm cấu trúc
Nhất cho:
- Nhà đầu tư
- Phân tích vĩ mô
Sự quan tâm mở di chuyển chậm hơn.
Nhưng nó thường cho thấy nơi mà tiền lớn đang âm thầm nghiêng về.
Bạn Nên Sử Dụng Cái Nào?
Nếu bạn mới bắt đầu, hãy bắt đầu với PCR dựa trên thể tích.
Dễ đọc hơn.
Nó phản ứng nhanh hơn.
Và nó dạy bạn cách cảm xúc cư xử xung quanh các điểm chuyển mình.
Nhận định của chuyên gia #1: phòng ngừa làm biến dạng tín hiệu
Có một điều mà không xuất hiện trong sách giáo khoa.
Trên các chỉ số rộng như S&P 500, việc mua quyền chọn bán nhiều có liên quan gì đến cược giảm giá.
Các quỹ lớn mua quyền chọn bán như một hình thức bảo hiểm.
Họ làm điều đó một cách có hệ thống.
Họ làm điều đó bất chấp triển vọng.
Điều đó có nghĩa là các PCR chỉ số tự nhiên chạy cao hơn các PCR mức cổ phiếu.
Một PCR của 1.1 có thể là cực đoan đối với một cổ phiếu cá nhân như Apple.
Đối với một chỉ số, điều đó có thể là bình thường.
Đây là lý do tại sao các nhà giao dịch có kinh nghiệm so sánh các chỉ số PCR với phạm vi lịch sử của riêng họ, không phải một con số cố định.
Những Sai Lầm Thường Gặp của Các Nhà Giao Dịch Với PCR
Ngay cả những chỉ số vững chắc cũng thất bại khi được sử dụng kém.
Các cái bẫy lớn nhất đây.
Xem PCR như một nút Mua hoặc Bán
PCR không phải là một yếu tố kích hoạt.
Đó là một công cụ trong bối cảnh.
Một chỉ số cao không có nghĩa là “mua ngay.”
Một chỉ số thấp không có nghĩa là “bán ngay.”
Nó có nghĩa là: Hãy chú ý. Một cái gì đó đang bị kéo dài.
Bỏ qua xác nhận giá
Cảm xúc có thể giữ ở mức cực đoan lâu hơn bạn mong đợi.
Thị trường có thể tham lam trong nhiều tuần.
Chúng có thể sợ hãi trong nhiều ngày.
Các nhà giao dịch thông minh chờ đợi:
- Các mức hỗ trợ hoặc kháng cự
- Những cây nến đảo chiều
- Chuyển động lực
PCR đặt nền tảng.
Giá đưa ra phán quyết.
Quên đi các chân trời thời gian
Nỗi sợ ngắn hạn không phải lúc nào cũng quan trọng đối với các nhà đầu tư dài hạn.
Một đợt tăng PCR hàng ngày có thể không có nghĩa gì đối với ai đó nắm giữ trong nhiều năm.
Tương tự, việc định vị dài hạn có thể không giúp ích cho một nhà giao dịch trong ngày.
Khớp chỉ báo với khoảng thời gian của bạn.
Nhận định của chuyên gia #2: PCR hoạt động tốt nhất ở các cực độ cảm xúc
Trong giao dịch thực tế, PCR hầu như không có giá trị. Và điều đó cũng không sao.
Giá trị của nó xuất hiện khi:
- Tiêu đề cảm thấy kịch tính
- Mạng xã hội thì ồn ào
- Các nhà giao dịch cảm thấy chắc chắn
Những khoảnh khắc đó rất hiếm.
Đó là lý do tại sao chúng quan trọng.
Nhiều chuyên gia bỏ qua PCR cho đến khi nó đạt đến mức cảm thấy không thoải mái. Sau đó, họ tham gia, chậm lại và tìm kiếm sự xác nhận.
Nơi tìm dữ liệu PCR đáng tin cậy
Bạn không cần những công cụ đắt tiền.
Có những nguồn miễn phí tốt.
- CBOE – nguồn gốc ban đầu cho dữ liệu PCR chỉ số và cổ phiếu
- TradingView – tuyệt vời cho các lớp phủ hình ảnh và bối cảnh lịch sử
- Investopedia – giải thích và bối cảnh vững chắc
Nếu bạn có thể thấy tỷ lệ được vẽ bên cạnh giá, bạn đã đi trước hầu hết các nhà giao dịch.
Phương pháp PCR có hiệu quả đối với các cổ phiếu riêng lẻ không?
Có. Nhưng có một số điều kiện.
Các PCR ở mức cổ phiếu thì dễ biến động.
Lợi nhuận, tin tức và giao dịch đơn lẻ có thể làm lệch lạc chúng.
Chúng hoạt động tốt nhất:
- Trên các cổ phiếu lỏng
- Với hoạt động lựa chọn ổn định
- Tránh xa các sự kiện lớn
Đối với hầu hết các nhà giao dịch, PCR đáng tin cậy hơn trên các chỉ số như S&P 500 hoặc NASDAQ.
Tỷ lệ Put-Call có thể dự đoán các vụ sụp đổ không?
Không. Và nó không cố gắng.
Nó phản ánh tâm trạng, không phải nguyên nhân.
Trong các vụ tai nạn, PCR thường tăng vọt sau khi nỗi sợ hãi xuất hiện.
Trước khi có sự điều chỉnh, nó thường giữ ở mức thấp trong một thời gian dài.
Hãy coi nó như một đèn cảnh báo, không phải là quả cầu pha lê.
Tại sao PCR đôi khi tăng lên trên 1.5 hoặc thậm chí 2.0
Điều này thường xảy ra khi:
- Sự biến động tăng vọt
- Bảo vệ trở nên cấp bách
- Tính thanh khoản cạn kiệt
Các chỉ số đó rất hiếm.
Khi chúng xuất hiện, thị trường đã gặp căng thẳng.
Về mặt lịch sử, những cực đoan này thường phù hợp với mức thấp của sự hoảng loạn.
Nhưng thời gian thì không bao giờ chính xác.
PCR đang dẫn đầu hay theo sau?
Nó được coi là một chỉ báo dẫn đầu trái chiều.
Nó không chờ giá quay đầu.
Nó gợi ý khi các điều kiện đủ chín muồi cho một sự quay đầu.
Điều đó làm cho nó trở nên mạnh mẽ.
Và nguy hiểm nếu sử dụng một mình.
Những Suy Nghĩ Cuối Cùng: Cách Thực Sự Sử Dụng PCR
Tỷ lệ Put-Call sẽ không làm bạn trở nên giàu có chỉ bằng chính nó.
Điều này sẽ làm:
- Giữ cho bạn vững vàng khi cảm xúc dâng trào
- Giúp bạn tránh việc theo đuổi các giao dịch đông đúc
- Khuyến khích sự kiên nhẫn ở những cực đoan
Sử dụng nó như một bộ lọc.
Sử dụng nó như một cảnh báo.
Sử dụng nó như một lời nhắc rằng các thị trường trước tiên là hệ thống con người, sau đó mới là hệ thống toán học.
Khi mọi người đều cảm thấy giống nhau, thường thì điều gì đó sẽ đổ vỡ.
PCR giúp bạn nhận ra khoảnh khắc đó.

