
Advance/Decline (A/D) Line is a tech indicator that shows the daily change between the number of advancing and declining issues (e.g., stocks). The instrument helps traders understand the overall market situation, identify the current trend, and predict possible ongoing reversals.
Key takeaways:
- What is the A/D Line Indicator?
- What is the Formula for the Advance/Decline (A/D) Line?
- What are the Benefits and Limitations of the A/D Line?
- How to Use the Indicator in Practice?
- How to Add the Advance/Decline (A/D) Line to Metatrader?
- Which Indicators to Combine the A/D Line with?
What Does the Advance/Decline (A/D) Line Mean?
The A/D Line is an indicator that shows traders the breadth of the financial market. Such an instrument represents the difference between the number of assets that are advancing and declining.
The Advance/Decline (Line) indicator roots back to the 1930s when the instrument was primarily used to predict the market activity on the New York Stock Exchange. The A/D Line was popularized by Richard Russel in the 1960s through his “Dow Theory Letters.” Russel underlined how effective the instrument is for understanding the market health and confirming the trend strength.
Since then the A/D Line is understood as an important and effective instrument that is combined with other tech indicators to get accurate signals.
How to Calculate the Advance/Decline (A/D) Line Formula?
For calculating the A/D Line indicator you need to follow some simple steps:
- Identify the number of advancing and declining issues within a trading day.
- Calculate the net advances. Use the following formula:
NA = NA – ND
- NA – Net Advances;
- NA – the Number of Advancing issues within a trading day;
- ND – the Number of Declining issues within a trading day.
- Find out the value of the Advance/Decline Line indicator of the previous trading day.
- Calculate the A/D Line indicator according to the following formula:
A/DC = A/DP + NA
- A/DC – A/D current;
- A/DP – A/D previous;
- NA – Net Advances.
The Example of How to Calculate the A/D Line Indicator
Having the above mentioned formula, we are able to calculate the A/D line in practice. For instance, we need to calculate the indicator for S&P 500. What do we need to make first?
- Let’s identify the number of advancing and declining stocks within a trading day. We have 315 stocks that grew in price and 185 stocks that dropped down.
- The next step lies in calculating the Net Advances (315 – 185). The NA value is 130.
- Then we need to find the ADL for the previous day (A/DP). The chart shows that the ADL indicator’s value for the previous trading day is 100.
- As such, to calculate the current A/D Line value we need to sum up the Net Advances and the previous ADL (130 + 100 = 230). The Advance/Decline Line indicator is 230.
To calculate all the next ADL values, we just need the number of advancing and declining stocks. Here are the results illustrated by the table:
| Day | The number of advancing stocks | The number of declining stocks | Previous ADL | Current ADL |
|---|---|---|---|---|
| Day 1 | 315 | 185 | 100 | 230 |
| Day 2 | 270 | 230 | 230 | 270 |
| Day 3 | 195 | 305 | 270 | 160 |
| Day 4 | 410 | 90 | 160 | 480 |
| Day 5 | 130 | 370 | 480 | 240 |
How breadth becomes a line
Five sessions. Start at zero; add each day’s net advances.
How to Use the A/D Line Indicator in Practice?
The simple formula helps us to calculate the Advance/Decline Line values. What should a trader do with the received information?
The A/D Line indicator helps a trader to identify the current trend and understand how strong that trend is.
Let’s look at a few possible scenarios when using the Advance/Decline Line instrument:
- A set of other indicators show that the uptrend dominates the market. According to the A/D Line, the vast majority of issues are advancing. In such a situation the indicator confirms other instruments, and a trader should open long positions.
- Indicators tell a trader that the uptrend dominates the market; meanwhile, the Advance/Decline Line shows that the number of advancing and declining issues is almost equal or even the declining issues are the leading ones. Such a situation is called the bearish divergence. The market uptrend is not strong enough. There is a high possibility of the ongoing trend reversal. Traders should open short positions.
- Based on the number of indicators, traders understand that the downtrend is on the market while the A/D Line informs a trader that most issues are advancing. Here is why one can predict the trend reversal from downward to upward.
When using the Advance/Decline Line indicator, a trader receives exceptionally important information:
- The indicator either confirms the current trend or shows that its strength is getting lower coming closer to reversal.
- In case of divergence, the ongoing trend reversal is just the matter of time in the vast majority of cases.
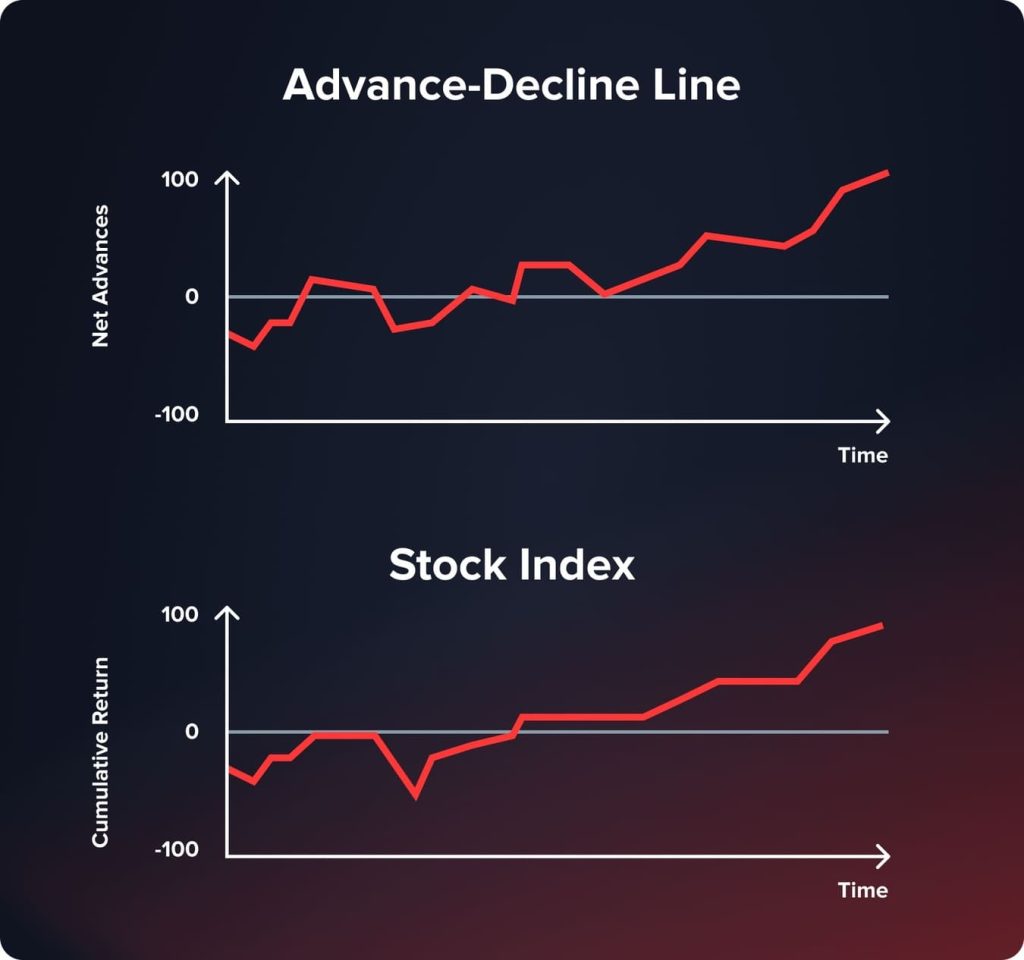
Price up. Is breadth coming along?
Keep the index path. Change only the A/D line.
A few heavily weighted stocks can lift an index even as the A/D line falls.
Divergence calls for context, not an automatic trade.
The Benefits and Limitations of the A/D Line
What are the core advantages and limitations of the indicator? Among the top benefits one can point out the following pros:
- The indicator unlocks a broader market perspective. Through the A/D Line indicator, a trader can understand what is going on within the whole sector, not a particular asset.
- The instrument helps traders predict the future trend reversals. The Advance/Decline Line is rather an accurate indicator that makes it possible to predict whether a trend keeps going or is coming closer to the reversal point.
- The A/D Line is an effective instrument for trend confirmation. Professional traders frequently use the indicator as an auxiliary instrument to confirm the market trend previously identified with other tech instruments.
As for the limitations, the following minuses should be taken into account:
- Delisted stocks affect the A/D Line calculations. When a certain asset is delisted from the sector, it keeps affecting the instrument as it was taken into account in previous calculations.
- The indicator gives equal weight to all issues. Many indexes provide issues with different weights based on their market capitalization. As for the A/D Line, it gives equal weight to every asset.
- There is a probability of false signals. In the moments of market volatility, the indicator can provide traders with false signals. Furthermore, the A/D Line is based on the difference between advancing and declining assets only.
How to Add the Indicator to the Metatrader?
The Advance/Decline Line is not among the indicators that are included in the list of Metatrader instruments by default. In order to add the instrument, a trader should follow some simple steps:
- Download the file from a trusted source. Pay attention to the version of your trading platform. When talking about Metatrader 5, download the file that is compatible with the 5th version. You should get a file ex4 or mql.
- Open your Metatrader terminal.
- Click to the “File” button and then select the “Open Data Folder.”
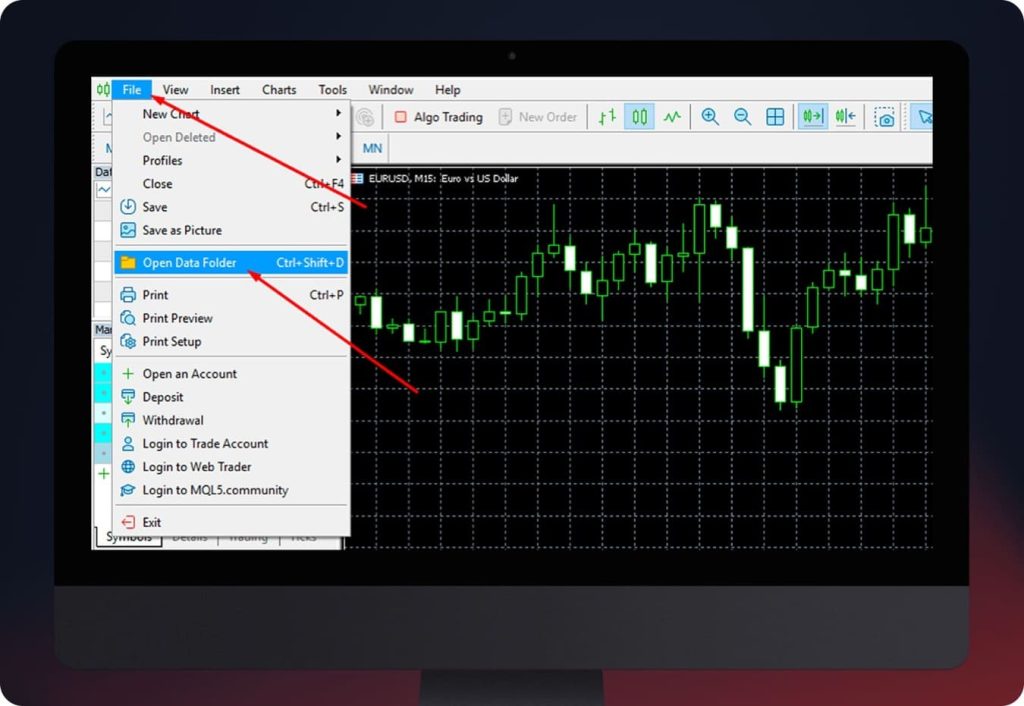
- In the new window you will find the list of folders. Open the “MQL5” (MQL4) one. Then go to the “Indicators” folder.
- Move a file you’ve previously downloaded to the folder.
- Reload Metatrader to find the A/D Line among the available instruments.
Which Indicators to Combine with the Advance/Decline Line?
The A/D Line is usually used as the trend confirmation, together with a set of other tech analysis indicators. What are those instruments?
- Moving Averages. The MA instrument is among the most widely used indicators that informs traders about the average price of an asset – the line is constantly updated.
- MACD. The Moving Average Convergence Divergence (MACD) indicator is based upon the Moving Averages and shows the direction and strength of the market trend.
- RSI. The Relative Strength Index is an oscillator that shows the overbought and oversold areas between 0 and 100. The asset is overbought when the indicators goes above the 70 line and is oversold when the RSI is under the line 30.
Let’s apply the above mentioned indicators to the chart to understand how to combine those with the A/D Line.
How to Read the Chart: the Example of a Trading Strategy Based upon the Advance/Decline Line
According to the trading strategy, we need to apply MA 10, MA 5, RSI and A/D Line to the chart. We get the following situation:
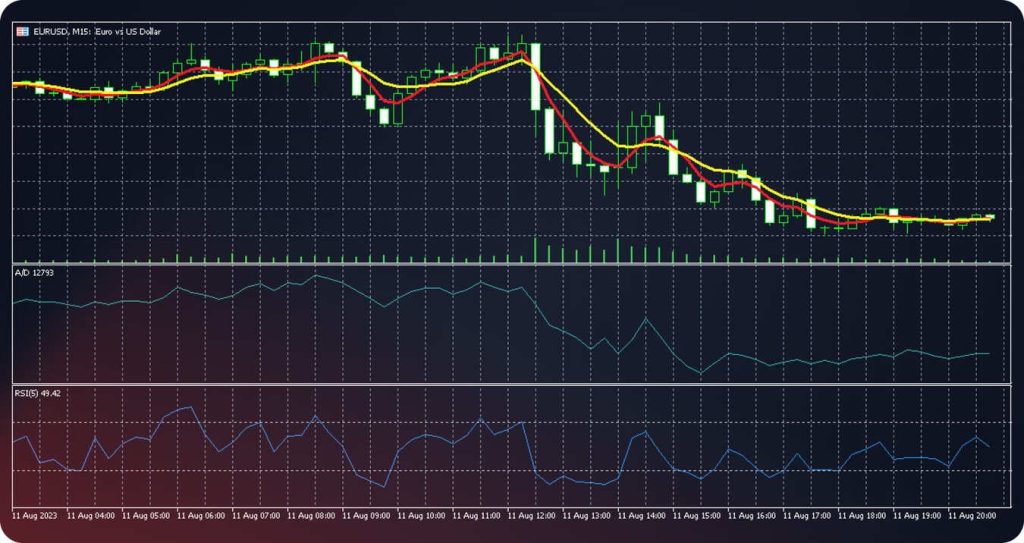
What should we do to open long/short positions?
Open a short position when:
- The MA 5 line crosses the MA 10 line from the top to the bottom.
- The RSI index shows that the asset is in the overbought area.
- The A/D Line goes downwards.
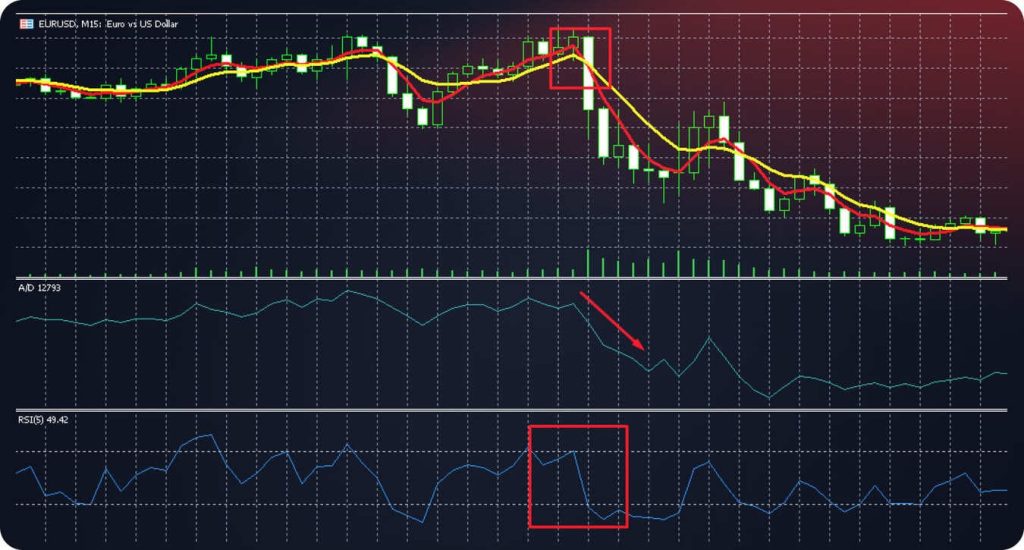
The MA crossing and RSI predict the ongoing trend reversal from upward to downward; meanwhile, a trader needs the Advance/Decline Line to get the confirmation of what is going on in a broader sense. When the A/D Line is going downwards, the number of declining issues is much higher; which is why the market is ready for the trend reversal.
Open a long position when:
- The MA 5 line crosses the MA 10 line from the bottom to the top.
- The RSI index shows that the asset is in the oversold area.
- The A/D Line goes upwards.
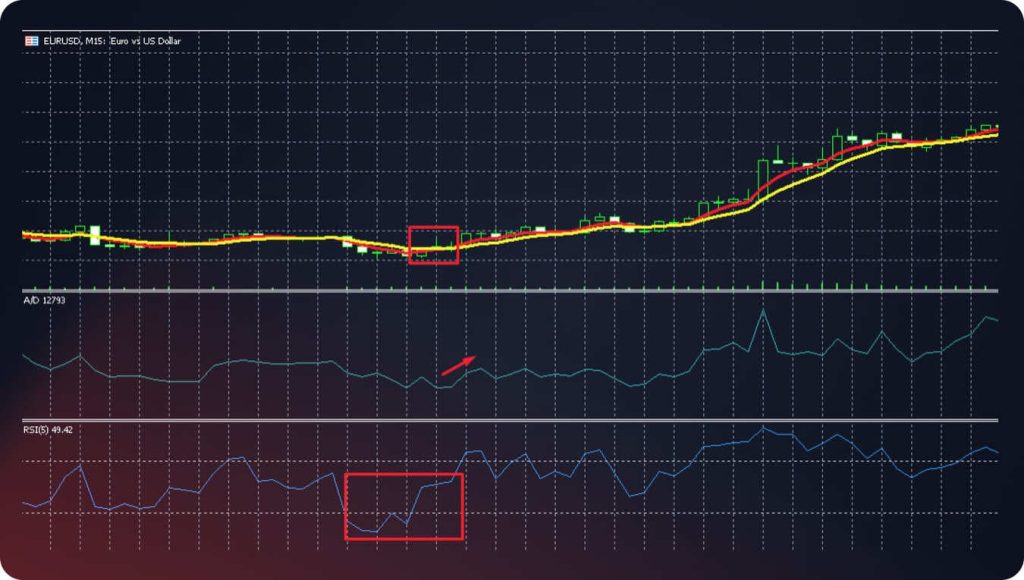
The MA crossing and RSI predict the ongoing trend reversal from flat to upwards, and the A/D Line confirms such a market situation, as the indicator shows the domination of advancing issues.
Compare the Line with the Right Index
An A/D Line counts stocks in a particular exchange or index. Compare it with that same group. An NYSE-wide A/D Line and the S&P 500 can move differently simply because they cover different stocks. For an S&P 500 breadth check, use an A/D series built from S&P 500 constituents.
Check the lookback period as well. A five-day disagreement is less persuasive than one that persists across several swings. The indicator counts each advancing stock equally, while many headline indices give larger companies more weight. A few large stocks can lift a capitalization-weighted index even as many smaller constituents lag.
| Index | Matching A/D Line | Practical Reading |
|---|---|---|
| New high | New high | Broad participation confirms the move so far. |
| New high | Lower high | Participation is narrowing; investigate, but do not assume an immediate reversal. |
| New low | Higher low | Fewer stocks are joining the decline; wait for price evidence before treating it as a turn. |
A moving average can provide price-trend context here. It answers a different question from the A/D Line, which measures participation. Neither one, on its own, sets a position size or validates a trade. If you use divergence in a trade plan, define what would invalidate the idea and where a stop order would fit before entering.The indicator can expose narrowing participation while a headline index is still rising. That may prompt a closer review of the trend, but it does not reliably predict when a reversal will happen.The stock universe can change. Additions, removals, delistings, and differences in data coverage can affect historical breadth comparisons. Check which constituents the data provider counted, especially on long charts.Choose a trusted custom indicator compatible with your platform. For MetaTrader 5, the source file is .mq5 and the compiled indicator is .ex5; MetaTrader 4 uses .mq4 and .ex4. MetaTrader 5’s official help explains the MT5 folder and compilation steps.
Before using the custom indicator, check where it gets advancing and declining counts and which market those counts cover. A file installed on a price chart does not by itself supply breadth data for an exchange or index. If the data source is unclear, the resulting line may answer a different question from the one you intended.
A moving-average cross and an overbought RSI describe price and momentum over the chosen period. A falling A/D Line adds evidence that participation is weakening. Together they may justify a closer look at a short setup, but they do not guarantee or time a reversal.
A bullish moving-average cross and an oversold RSI may draw attention to a possible change in price direction. A rising A/D Line suggests more stocks are joining the move. Check what the index actually does next before treating those signals as confirmation.
The A/D Line is most useful as a check on participation. Compare it with the matching index and use it alongside price action and any other tools that answer a different question. A disagreement can reveal a weakening move, but it does not tell you when to buy, sell, or expect a reversal.
The calculation is straightforward if the advance and decline counts are reliable. Its value as a trading signal varies by stock universe, timeframe, and the rule used to interpret it. There is no universal accuracy rate for predicting reversals, because the line measures participation rather than forecasting a date or price.
The standard A/D Line needs a defined group of securities and a count of how many advanced or declined. It is most natural for a stock exchange, stock index, or sector. It is not meaningful for one forex pair or one stock by itself. A provider could define a currency-pair or crypto-asset basket, but you would need to know exactly what it contains and how prices are counted.
The Bottom Line: Should a Trader Use the A/D Line in Tech Analysis?
The Advance/Decline Line is an effective instrument that theoretically can be used independently; meanwhile, professional traders prefer to apply the A/D Line as a confirmation instrument. They activate a set of tech indicators (e.g. MA 5 + MA 10 + RSI) that helps them predict further trend reversals, and the A/D Line is used to confirm the signal.

