
The trading floor in 2026 isn’t a room full of shouting people in suits; it’s a quiet room with a fast internet connection and a disciplined mind. While retail traders now have access to “institutional grade” tools, the failure rate remains high. Why? Because most people treat the market like a slot machine instead of a business.
Success this year isn’t about finding a secret indicator that no one else knows. It’s about building a repeatable process that works when you’re tired, stressed, or on a losing streak. Here is a deep dive into the 15 strategies that are currently defining the 2026 market landscape.
Risk Warning: Trading involves significant risk. You can lose your entire capital. This article is for educational purposes only and is not financial advice. Markets in 2026 move fast; always test new ideas in a demo environment before risking real money.
Quick Comparison
| Strategy | Timeframe | Focus | Technical Skill | Risk Profile |
| Day Trading | Intraday | Daily Volatility | High | High |
| Momentum | 1–3 Days | Sentiment & Volume | Medium | Med-High |
| Scalping | Seconds | Order Flow | High | High |
| Trend Following | Weeks – Months | Directional Bias | Low-Med | Medium |
| Mean Reversion | Days – Weeks | Statistical Extremes | Medium | Medium |
| Position Trading | Months – Years | Macro Themes | Medium | Low-Med |
| Arbitrage | Instant | Efficiency Gaps | V. High | Low |
| Swing Trading | 2 Days – 2 Weeks | Price Cycles | Medium | Medium |
| HFT | Milliseconds | Latency/Defense | Extreme | High |
| Pairs Trading | Weeks | Relative Value | High | Medium |
| Market Making | Continuous | Yield/Fee Collection | V. High | Medium |
| DCA | Ongoing | Average Pricing | Low | Low |
| Options | Flexible | Income & Hedging | High | High |
| Breakout | Hours – Days | Volatility Pops | Medium | Med-High |
| News Trading | Minutes | Events & Data | High | High |
The Professional Mindset: It’s Not About the Charts
Before we talk about entries and exits, we have to talk about your head. In 2026, the market is a “Zero-Sum” game. For you to buy a stock and make $1,000, someone else had to sell it to you and (effectively) lose that opportunity.
The Three Pillars of the 2026 Trader:
- Risk Management: If you risk 5% of your account per trade, you only need 20 bad trades to go to zero. Professionals risk 1% or less.
- Emotional Neutrality: You don’t get happy when you win, and you don’t get angry when you lose. You just execute the plan.
- Technological Edge: If you’re trading on a 5-year-old laptop over public Wi-Fi, the bots will eat your lunch. Speed and reliability matter.
Modern Day Trading: The VWAP & Liquidity Hunt
In 2026, the VWAP (Volume Weighted Average Price) is the single most important line on a professional day trader’s chart. Unlike a moving average, which only looks at time, the VWAP factors in where the “Big Money” is actually buying and selling. It acts as the “Fair Value” for the day.
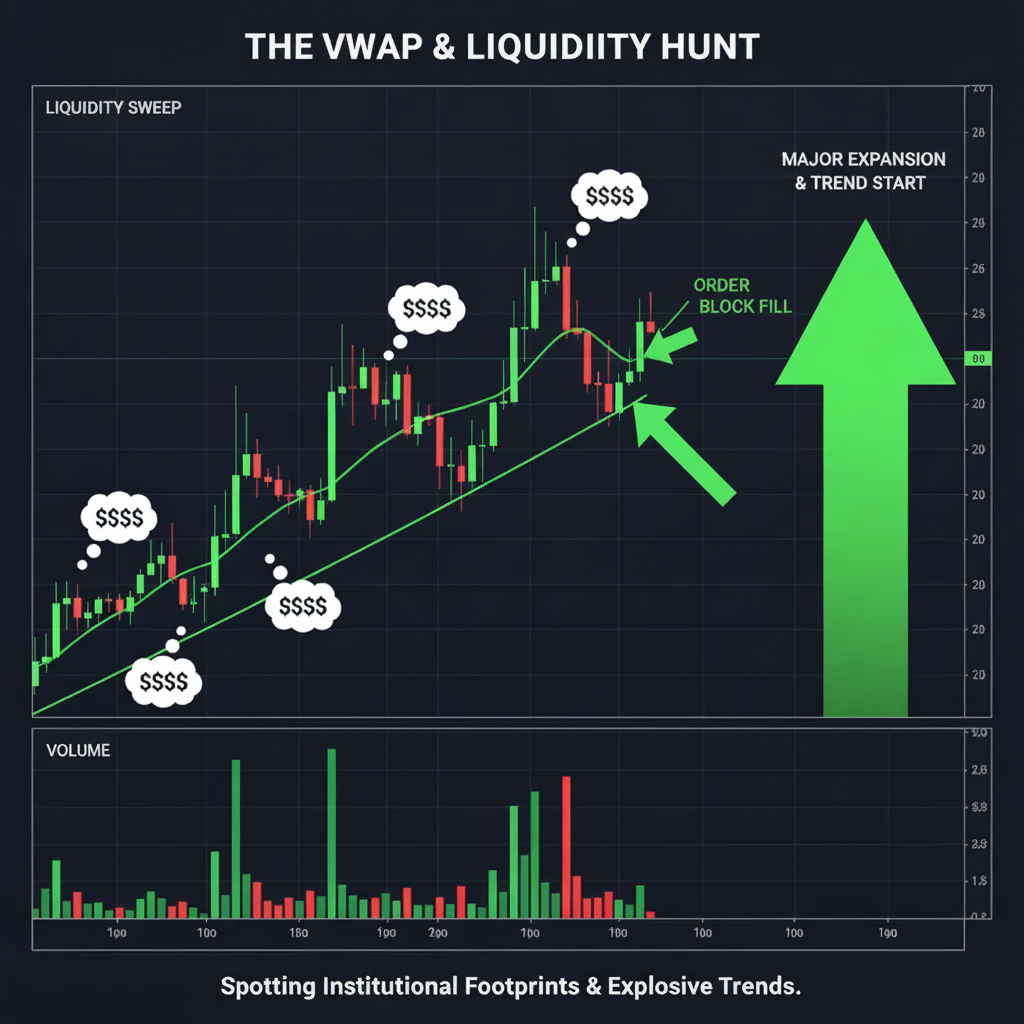
The Step-by-Step Setup
- The Filter: 30 minutes before the open, scan for stocks or tokens with Relative Volume (RVOL) > 2.0. This tells you the “smart money” is present.
- The Opening Range: Wait for the first 15–30 minutes of the market open. Do not trade. This creates your initial High of Day (HOD) and Low of Day (LOD) battle lines.
- The Entry (The Pullback): Look for the price to break above the VWAP on high volume. Now, wait. You want the price to come back down and “kiss” the VWAP line without breaking it.
- The Trigger: Enter Long when a green “Hammer” or “Bullish Engulfing” candle forms exactly on that VWAP touch.
- The Target: Your primary target is the HOD. Your stop-loss is a 1-minute candle closing below the VWAP.
Pros: High precision; clear “line in the sand” for risk management; great for volatile 2026 markets.
Cons: Requires constant screen time; “fake-outs” are common in the first hour.
Main Risk: Liquidity Traps. Algorithms often push prices below the VWAP to trigger retail stop-losses before reversing.
Momentum Trading: The “RVOL” Flag Play
Momentum is about identifying a runaway train and jumping on it before it leaves the station. In 2026, this is driven by high-speed news and social sentiment.
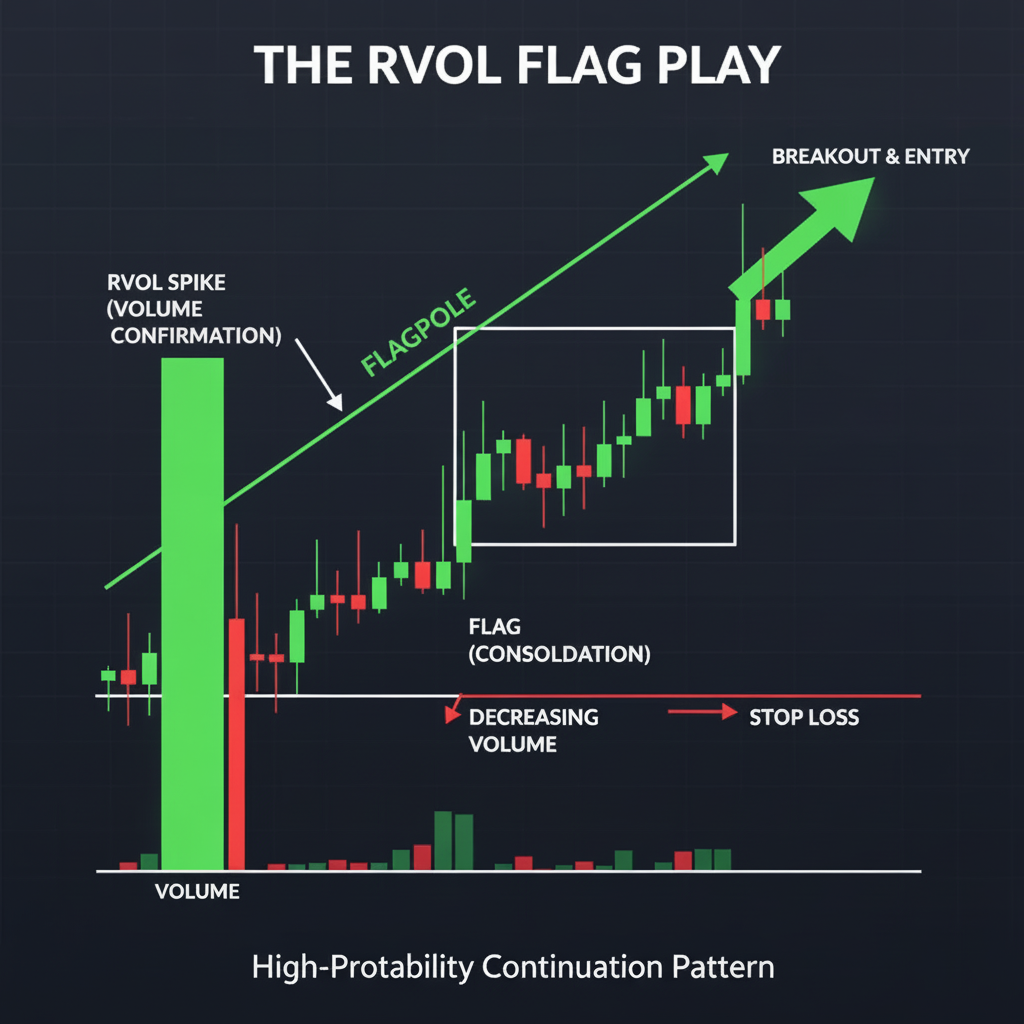
The Step-by-Step Setup
- The Impulse: Look for a 5–10% vertical move in a short window. This forms your “Flagpole.”
- The Consolidation: The price will stop going up and start moving sideways or slightly down in a tight channel. This is the “Flag.” The volume must drop significantly here; if volume stays high during the dip, the pros are selling, not resting.
- The Entry: Place a “Buy Stop” order just above the top trendline of the flag.
- The Rule of Thumb: Measure the height of the “Flagpole.” Your profit target should be that same distance added to the top of your entry.
Pros: High reward-to-risk ratio; easy to spot visually; benefits from “FOMO” cycles.
Cons: High slippage (getting a worse price) during fast moves; easy to get caught at the very top.
Main Risk: Flash Reversals. Momentum can evaporate in seconds if a bigger macro news event hits the wires.
Scalping: The Level 2 “Wall” Strategy
Scalpers in 2026 don’t trade charts as much as they trade the Order Book. This is a high-speed strategy where you “front-run” the big orders.
The Step-by-Step Setup
- The Tool: Open your Level 2 / Depth of Market (DOM) window. Look for a massive sell order (a “Wall”)—for example, a 100,000-share sell order at a round number like $50.00.
- The Tape Speed: Watch the “Time & Sales.” When you see a flurry of green prints (buying) hitting that $50.00 mark and the 100k order starts shrinking fast.
- The Entry: As soon as the wall thins out to 10k or less, you buy at $50.01.
- The Move: When a wall breaks, the price usually “pops” 10–20 cents instantly as short-sellers panic and cover.
- The Exit: Get out after the initial 10-second surge. Profit is profit.
Pros: Very high win rate; limited exposure to market crashes (you’re only in for seconds).
Cons: Requires expensive low-latency hardware; mentally draining; commissions eat profits.
Main Risk: Iceberg Orders. A “hidden” sell order might sit behind the visible one, absorbing all buying and causing the price to crash back down.
Trend Following: The EMA “Cloud” Strategy
This is the most systematic way to trade. It removes the “guesswork” and relies on the 2026 trend-following algorithms used by major funds.
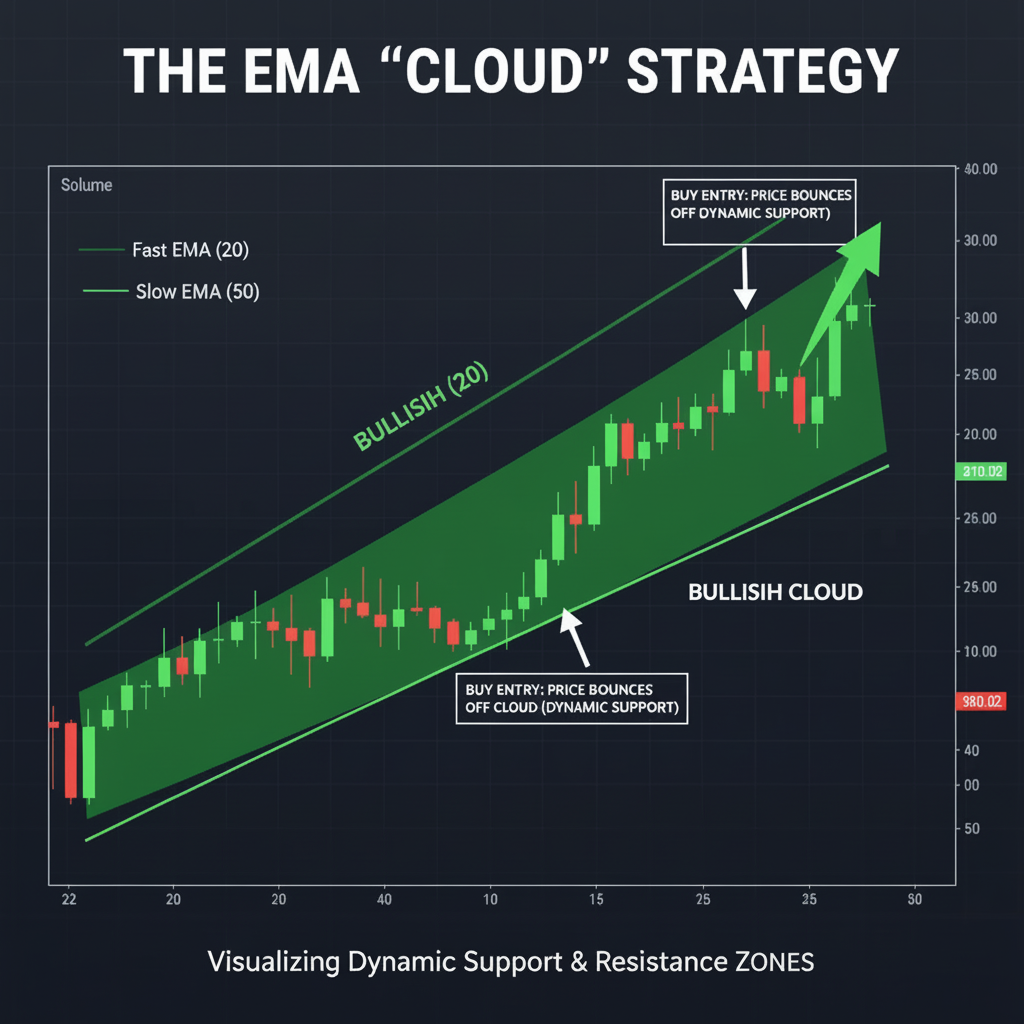
The Step-by-Step Setup
- The Chart Setup: Add two lines: the 21 EMA (Fast) and the 50 EMA (Slow). The space between them is your “Cloud.”
- The Filter: If the 21 is above the 50, you only look for “Buy” opportunities.
- The Entry: Instead of buying the “cross,” wait for the price to pull back into the “Cloud.”
- The Confirmation: Wait for a green candle to close above the 21 EMA again. This signals the trend is resuming.
- The Exit: Do not set a fixed target. Move your stop-loss up to the previous 4-hour low and stay in until the 21 EMA crosses back below the 50 EMA.
Pros: Low maintenance; huge winning trades; “set and forget” potential.
Cons: Low win rate (around 30–40%); you will experience “Death by a Thousand Cuts” in sideways markets.
Main Risk: Whipsaws. In a choppy market, you will get “stopped out” repeatedly as the EMAs cross back and forth.
Mean Reversion: The RSI Divergence Snap
This is a “Counter-Trend” strategy. You are betting that the market has gone “too far, too fast” and is about to snap back to the average.
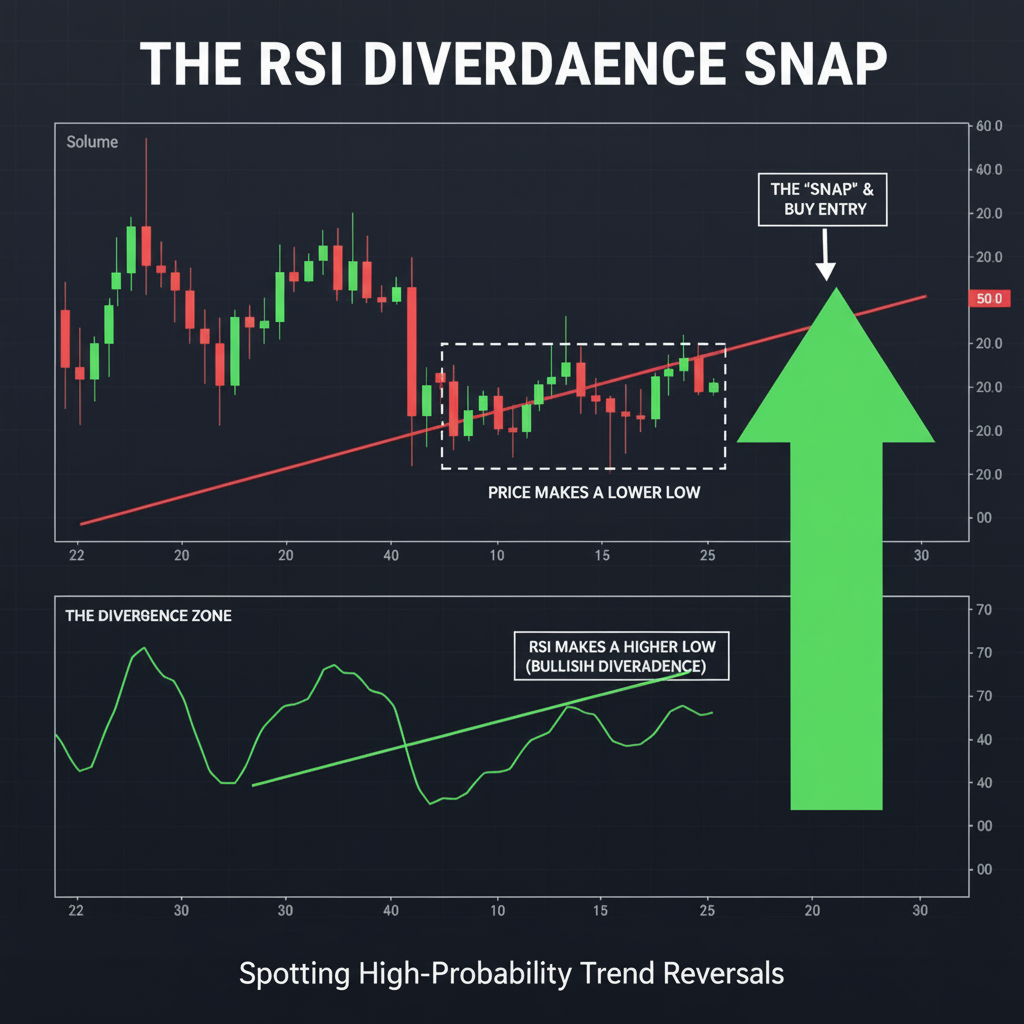
The Step-by-Step Setup
- The Indicators: Use Bollinger Bands and the RSI.
- The Overextension: Look for a candle to close entirely outside the upper Bollinger Band. This means the price is statistically “exhausted.”
- The Divergence: Look at the RSI. If the price made a “Higher High” but the RSI made a “Lower High,” this is Bearish Divergence. The buyers are tired.
- The Entry: Enter Short on the close of the first red candle that moves back inside the Bollinger Band.
- The Exit: Target the Middle Line (the 20 SMA) of the Bollinger Bands.
Pros: Logical and math-based; works very well in range-bound (sideways) markets.
Cons: High risk; requires “fighting the trend.”
Main Risk: Steamroller Risk. In a parabolic market (like a massive 2026 tech rally), mean reversion can lead to huge losses as the price keeps climbing and never looks back.
Position Trading: The “Macro Architect”
Position trading is for the patient. You aren’t watching 5-minute candles; you’re watching the 2026 global shifts in energy, AI, and interest rates. You trade the “Why,” not just the “How.”
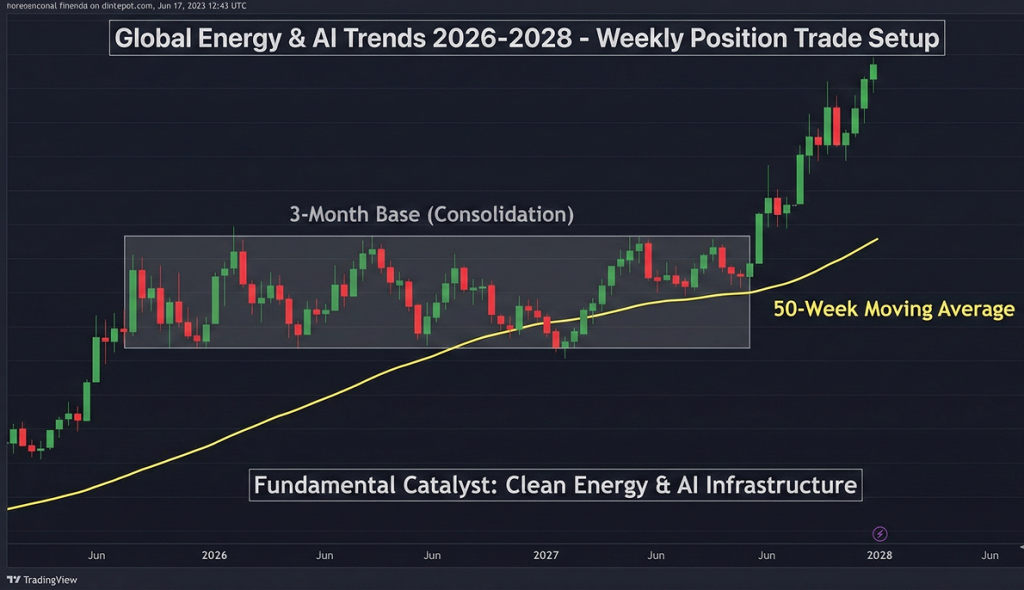
The Step-by-Step Setup
- The Fundamental Catalyst: Find a sector with a 2-year growth story (e.g., Rare Earth Mining for EV batteries).
- The Entry (The Consolidation): Open a Weekly Chart. You want to see the price moving sideways for at least 3 months, forming a “Base.”
- The Confirmation: Use a 50-week Moving Average. You only enter when the price breaks above this line and holds for two consecutive weekly closes.
- The Management: Check your position once a week on Friday at the market close. Ignore the “daily noise.”
Pros: Very low stress; minimal time commitment; avoids the “Stop-Loss Hunting” of daily bots.
Cons: Capital is tied up for a long time; “opportunity cost” if the market stays flat.
Main Risk: Fundamental Shift. If a new technology makes your “clean energy” stock obsolete, the chart won’t save you. You must stay informed on the industry.
Arbitrage: The “Efficiency Gap” Hunter
Arbitrage is the closest thing to “free money” in trading, but in 2026, it requires serious tech. You are looking for the same asset trading at two different prices in two different places.
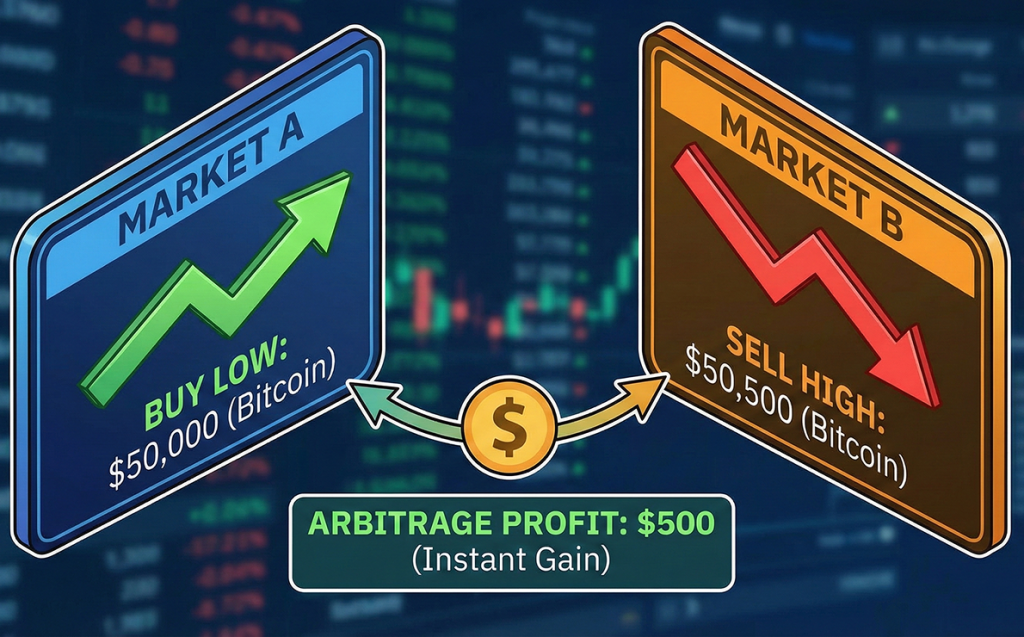
The Step-by-Step Setup
- The Asset: Usually done with highly liquid assets like Bitcoin, Gold, or Major FX pairs.
- The Software: You need an Arbitrage Scanner that monitors multiple exchanges (e.g., Coinbase vs. Binance, or a Centralized vs. Decentralized exchange).
- The Execution: When a 0.5% gap appears, the trade must be instant. You buy on the “cheap” exchange and sell on the “expensive” one simultaneously.
- The 2026 Twist: Look for Cross-Chain Arbitrage (e.g., ETH on Ethereum vs. ETH on a Layer-2 like Arbitrum).
Pros: Mathematically “Risk-Free” if execution is instant; doesn’t care about market direction.
Cons: Extremely high competition from institutional bots; requires significant capital to make small % gains worth it.
Main Risk: Execution Lag. If you buy on Exchange A but the price on Exchange B drops before you can sell, you’re stuck with a losing position.
Swing Trading: The Multi-Day Cycle
Swing trading captures the natural “breath” of the market. Stocks don’t move in straight lines; they move in waves. You are trying to catch the “Swing” from the bottom of a wave to the top.
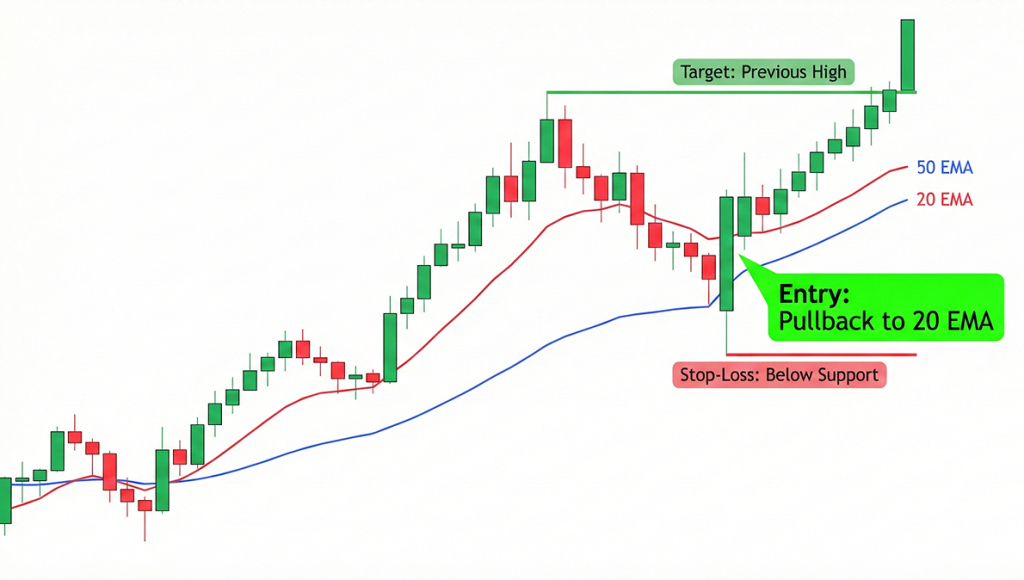
The Step-by-Step Setup
- The Structure: Use a 4-Hour or Daily Chart. Identify “Support” (the floor) and “Resistance” (the ceiling).
- The Pullback: Wait for the price to drop back to a previous support level during an uptrend.
- The Entry Trigger: Look for Confluence. You want the price at support, the Stochastic Oscillator in the “Oversold” zone, and a bullish candlestick pattern (like a Piercing Pattern).
- The Target: Set your first profit target at the previous high.
Pros: Perfect for people with full-time jobs; captures larger moves than day trading.
Cons: Exposed to “Overnight Risk” (bad news happening while you sleep); requires the discipline to hold through red days.
Main Risk: Gap Risk. A stock could close at $50 and open at $45 the next morning due to bad news, blowing right past your stop-loss.
High-Frequency Trading (HFT): Decoding the Machines
As a retail trader, you aren’t doing HFT (it requires servers in the exchange’s basement), but you must understand how they operate to avoid being their “Liquidity.”
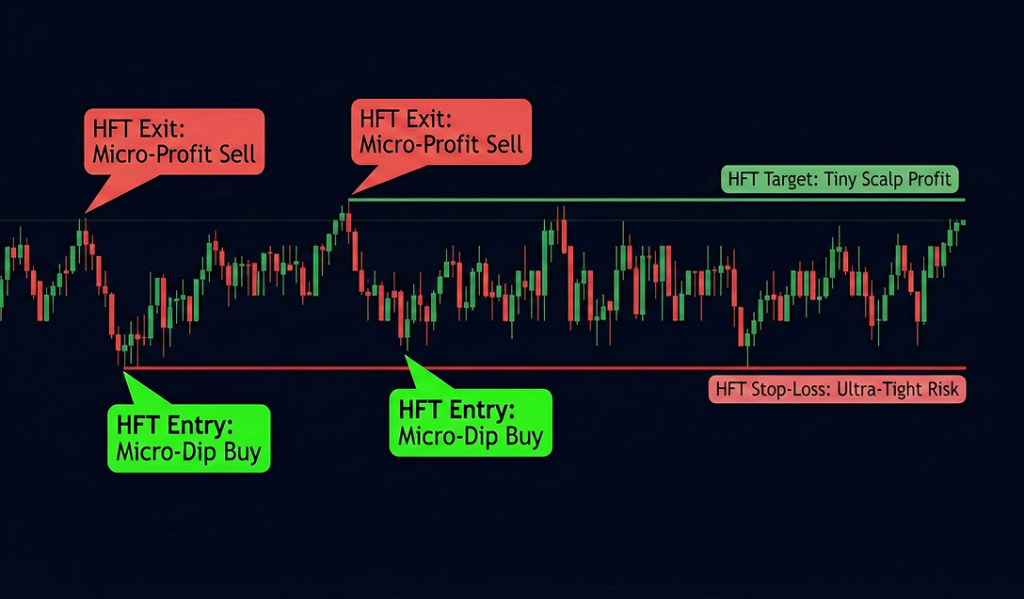
The Step-by-Step Setup
- Spotting the Algorhythm: Look for “Flash Spikes” followed by immediate reversals. These are often Stop-Hunts.
- The “Front-Run”: Bots see your buy order and “jump” in front of you to sell it back to you $0.01 higher.
- The Defense: Use Limit Orders exclusively. Never use a “Market Order,” as HFT bots will widen the spread the second you click “Buy,” costing you money.
- The Timing: Avoid trading during the first 60 seconds of a major news release. That’s when the “Bot Wars” are most violent.
Pros: Teaches you the “True” structure of the market; helps you find better entry prices.
Cons: You are fighting against billion-dollar computers; it can feel like the market is “cheating.”
Main Risk: Over-Leverage. Many retail traders try to fight HFT moves by adding to losing positions, which is exactly what the bots want.
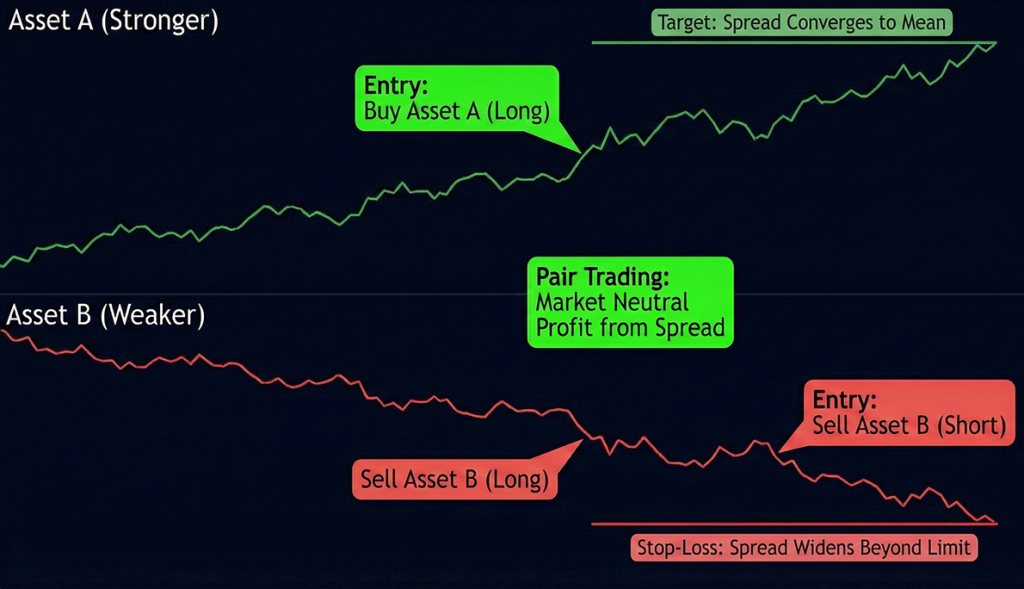
Pair Trading: The “Market Neutral” Edge
This is the thinking person’s strategy. You aren’t betting on the market; you’re betting on the relationship between two stocks.
The Step-by-Step Setup
- Find the Pair: Pick two companies in the same sector (e.g., Coca-Cola and Pepsi).
- The Correlation: Use a Correlation Coefficient tool. You want a score of 0.80 or higher (they move together).
- The Divergence: Wait for the “Spread” to widen. If Coca-Cola goes up 3% but Pepsi stays flat, they are “out of sync.”
- The Entry: Sell Coca-Cola (the overperformer) and Buy Pepsi (the underperformer).
- The Win: You profit when the two stocks return to their normal price relationship, regardless of whether the whole market went up or down.
Pros: Protects you from a market crash; very consistent in “choppy” years like 2026.
Cons: Modest returns; requires a margin account to short stocks.
Main Risk: Correlation Break. If one company gets sued or goes bankrupt, the correlation breaks forever, and the “spread” will never close.
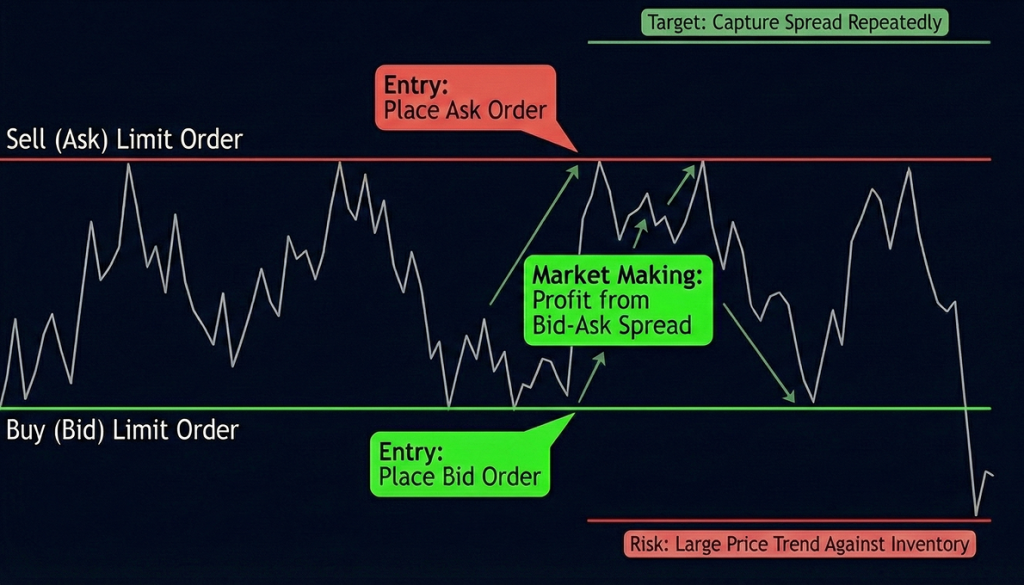
Market Making: Being the “House” in DeFi
In traditional finance, market making was reserved for firms with billion-dollar server rooms. In 2026, Decentralized Finance (DeFi) allows anyone to provide liquidity to a “pool” and earn a fee on every trade that happens. You aren’t betting on price direction; you’re collecting “tolls” from other traders.
The Step-by-Step Setup
- Select a Pair: Pick two assets you wouldn’t mind holding for the long term (e.g., ETH and USDC).
- Pick Your Range: Using “Concentrated Liquidity” (like Uniswap v4), you don’t just provide liquidity everywhere. You pick a price range say, $2,200 to $2,800 for ETH, where you think the price will stay for the next week.
- Deposit: You deposit equal values of both assets. Your capital is now the “inventory” that other traders use to swap.
- Rebalance: If the price moves out of your range, you stop earning fees. You’ll need to withdraw and reset your range based on the new market average.
Pros: Generates passive income (fees) regardless of market direction; helps the ecosystem by providing liquidity.
Cons: Highly technical; requires monitoring of “Pool Health.”
Main Risk: Impermanent Loss. If one asset (like ETH) rockets up 50% while your other asset (USDC) stays flat, you would have been better off just holding the ETH. The fees you earn must be higher than this loss for the strategy to be profitable.
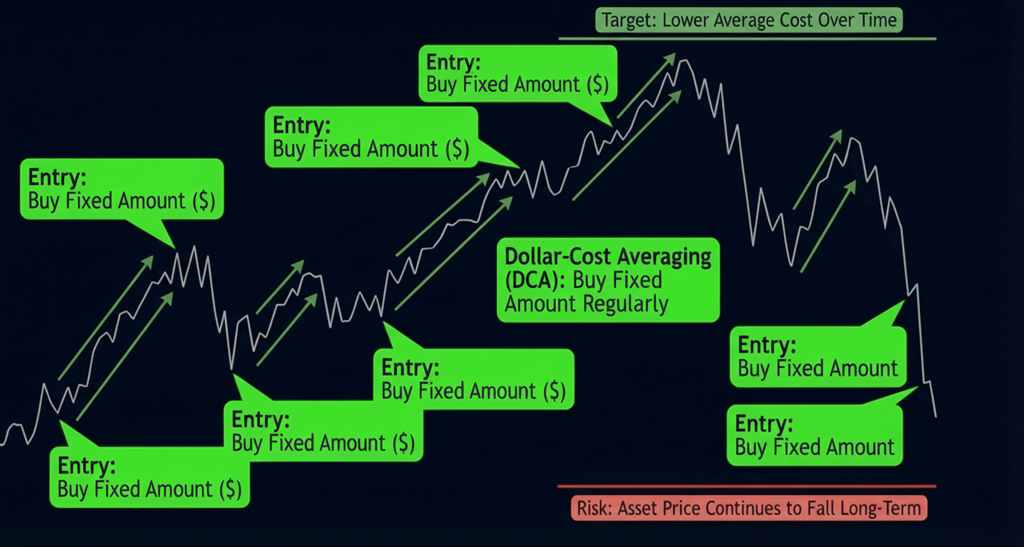
Dollar-Cost Averaging (DCA): The “Zen” Wealth Builder
DCA is the antidote to the stress of 2026 volatility. Instead of trying to “time” the bottom, you buy a fixed dollar amount at regular intervals. It’s the ultimate strategy for building a retirement or a long-term crypto portfolio.
The Step-by-Step Setup
- Pick Your Asset: Focus on high-conviction, blue-chip assets (e.g., S&P 500 ETF or Bitcoin).
- Automate: Set up a recurring buy. For example, $100 every Monday at 9:00 AM.
- The “Smart DCA” Upgrade: In 2026, many traders use Dynamic DCA. If the market is down 10% from its high, the app doubles your buy ($200). If it’s at an all-time high, it cuts it in half ($50).
- The Exit: DCA is for buying, but you need a target. “I will start selling 5% of my portfolio every time the asset reaches a new 52-week high.”
Pros: Removes emotion entirely; mathematically superior during bear markets; zero time commitment.
Cons: You will never “catch the exact bottom”; it feels boring during massive bull runs.
Main Risk: Fundamental Collapse. If you DCA into a company or a token that is going to zero (like a dying tech firm), you are just “throwing good money after bad.”
Options for Income: The “Covered Call” Rent
Options are often seen as risky, but professionals use them to generate “rent” on stocks they already own. This is how you turn a stagnant portfolio into a monthly paycheck.
The Step-by-Step Setup
- Ownership: You must own 100 shares of a stock (e.g., Apple or NVIDIA).
- Sell the Call: You sell one “Out-of-the-Money” (OTM) Call option. This means you are giving someone else the right to buy your shares if the price reaches a certain level (the Strike Price) by a certain date.
- Collect Premium: You get paid cash (the “premium”) immediately.
- Outcome A: If the price stays below the strike, you keep the cash and your stock. Repeat next month.
- Outcome B: If the price goes above the strike, you are forced to sell your shares at that price. You still keep the premium and the profit from the stock move.
Pros: Lowers your “cost basis” over time; provides income in sideways markets.
Cons: Caps your potential profit; requires owning 100 shares (which can be expensive).
Main Risk: The Big Moon Move. If your stock suddenly jumps 30% on news, you are forced to sell at the strike price, missing out on that massive gain.
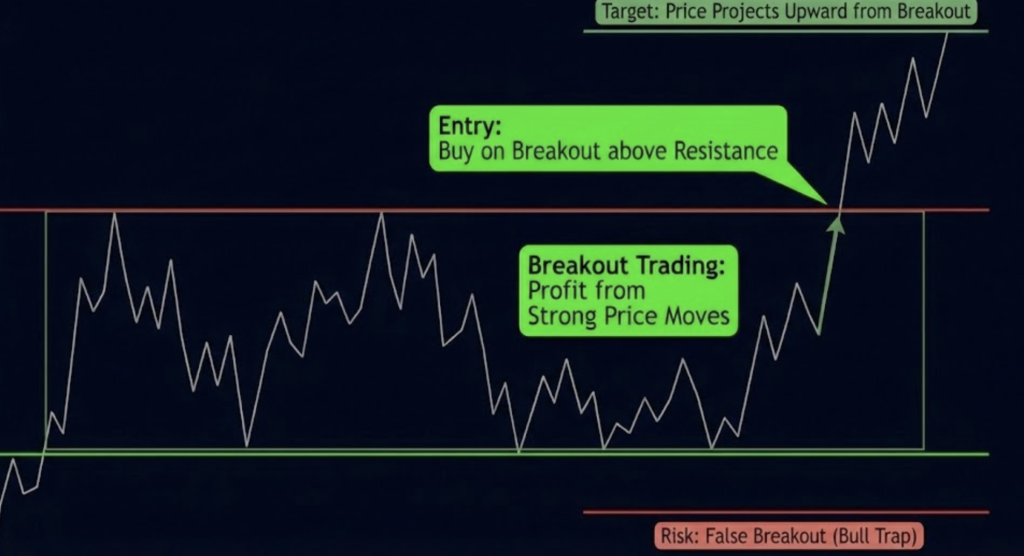
Breakout Trading: Catching the Coiled Spring
Breakouts happen when an asset has been “consolidating” (moving sideways) and finally explodes through a resistance level. In 2026, the key is distinguishing a “Real” breakout from a “Fakeout.”
The Step-by-Step Setup
- Identify the Box: Look for a price that has been stuck between two horizontal lines for at least two weeks. This is “energy” building up.
- The Volume Confirmation: You need a 300% surge in volume on the breakout candle. If the price moves up but volume stays flat, the bots are likely trapping you.
- The Retest Entry: Don’t buy the first spike. Wait for the price to come back and “touch” the old resistance line (which is now support). Enter there.
- Target: Measure the height of the “Box” and add it to the breakout point.
Pros: Can lead to the fastest profits in trading; works in any market (stocks, crypto, FX).
Cons: High “Fakeout” rate; requires nerves of steel to wait for the retest.
Main Risk: The “Bull Trap.” Prices often break out just enough to trigger your buy order before crashing back into the box. This is why volume confirmation is non-negotiable.
News Trading: The “Second Wave” Strategy
News trading in 2026 is a race against AI. By the time you read the headline, a bot has already bought and sold. To win, you trade the human reaction that follows.
The Step-by-Step Setup
- The Catalyst: Use an AI news aggregator to alert you to major surprises (e.g., an unexpected interest rate cut or a CEO resignation).
- Wait for the “Bot Spike”: The first 5 minutes will be chaos. Let the bots finish their high-speed battle.
- The “Second Wave” Entry: Look for a 15-minute consolidation after the initial spike. If the price holds the news-driven level, a second wave of human retail and institutional traders will likely push it further.
- The Exit: These moves are short-lived. Target the next major psychological level (e.g., $50, $100, or a 52-week high).
Pros: Can provide massive gains in under an hour; based on real-world events.
Cons: Extremely high slippage; spreads often widen during news, making it expensive to enter.
Main Risk: Whipsaws. In 2026, a news story can be “debunked” or clarified five minutes after it breaks, causing the price to do a complete 180-degree turn.
How to Save Your Money?
Protecting your trading capital is as important as making profits. Professionals follow simple rules to survive and thrive:
- Always set stop-losses – A stop-loss is your safety net, preventing a single mistake from wiping out your account.
- Mind your position size – Risk only 1% or less per trade to survive losing streaks and avoid emotional decisions.
- Use risk management tools – Trailing stops, hedging, and diversification across assets or timeframes reduce exposure.
- Focus on process over outcome – Plan trades, follow your rules, and let disciplined execution compound gains over time.
- Avoid chasing “home runs” – In fast 2026 markets, controlling risk consistently beats trying to hit massive, unpredictable trades.
Step-by-Step Setup: Your First Trade
If you want to start trading this week, here is exactly how to set up your workflow:
1. The Hardware
Stop trading on your phone. It’s too easy to make mistakes. Use a laptop with a large screen so you can see the volume and the price action clearly. Ensure you have a stable, wired internet connection.
2. The Charts (The “Core Four” Indicators)
Don’t clutter your screen. You only need four things:
- VWAP: For intraday direction.
- 9 EMA: For short-term momentum.
- 21 EMA: For the “Swing” trend.
- Relative Volume (RVOL): To see if the move is real or fake.
3. The Pre-Market Routine
Thirty minutes before the market opens, check the “Gap List.”
- What is moving?
- Why is it moving? (Earnings? FDA approval? Geopolitical news?)
- Draw your Support and Resistance lines on the Daily chart first. Then move to the 5-minute chart.
Final Thoughts: The “Survival” Checklist
Trading in 2026 is a marathon, not a sprint. If you want to be here in 2027, follow these four rules:

