Melhores indicadores de day trading para usar
Conteúdo
Day traders que negociam em mercados financeiros de ritmo acelerado devem utilizar indicadores apropriados. A análise do comportamento do mercado depende muito de indicadores como Médias Móveis, RSI, MACD, Bandas de Bollinger, Indicadores de Volume, Oscilador Estocástico e Níveis de Fibonacci. Eles auxiliam os traders a interpretar dados complexos, projetar oscilações de preços e identificar os momentos ideais de entrada e saída. Examinando seus usos, benefícios e maneiras únicas de serem incluídos com sucesso em planos de negociação, este artigo explora esses importantes indicadores.
Lista dos melhores indicadores de day trading:
- Médias Móveis
- Índice de Força Relativa
- Bandas de Bollinger
- Indicadores de volume
- Oscilador Estocástico
- Níveis de Retração de Fibonacci
- Convergência e Divergência da Média Móvel
Médias Móveis
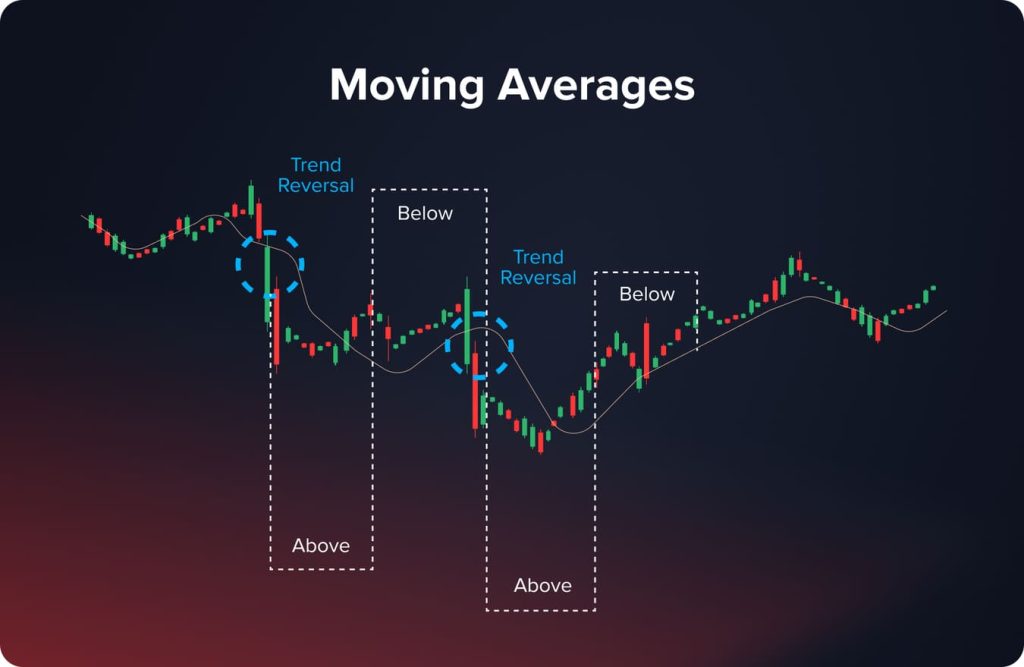
Indicadores básicos, chamados médias móveis, servem para suavizar os dados de preços, determinando assim a direção de uma tendência. Ao analisar o preço médio de um ativo ao longo de um determinado período, eles ajudam os traders a identificar tendências de alta ou baixa. A Média Móvel Simples (MMS), que se aproxima do preço médio em um determinado período, atribuindo igual peso a todos os pontos de dados, e a Média Móvel Exponencial (MME), que atribui maior peso aos preços mais recentes, aumentando assim a sensibilidade a dados recentes, são duas variedades principais.
Os níveis de suporte e resistência podem ser representados dinamicamente por meio de médias móveis. Quando o preço é negociado consistentemente acima da MM, isso pode indicar uma tendência de alta iminente; a ação do preço abaixo dela pode indicar uma tendência de baixa iminente. A combinação das Médias Móveis de 50 e 200 dias permite que os traders identifiquem cruzamentos de baixa ou cruzamentos de ouro de alta.
Índice de Força Relativa
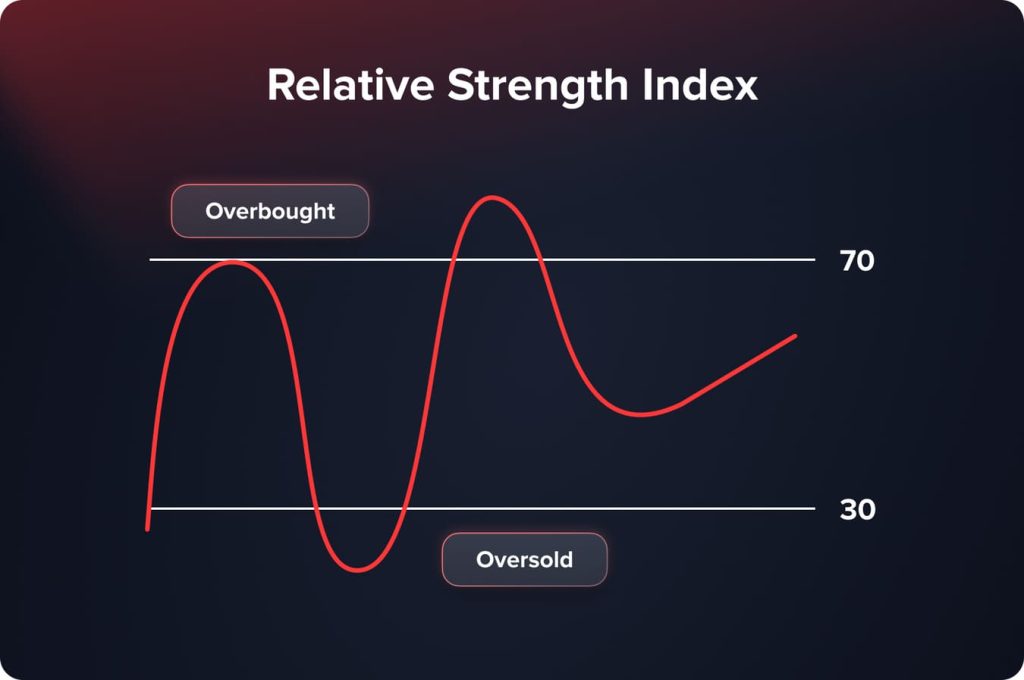
Avaliando o ritmo e a variação dos movimentos de preços em uma escala de 0 a 100, o RSI é um oscilador de momentum. Ele ajuda a identificar condições de mercado de sobrecompra e sobrevenda. Um RSI acima de 70 sugere condições de sobrecompra — que o ativo está caro e requer uma correção de preço. Um RSI abaixo de 30 sugere que o ativo está barato, implicando uma possível alta de preço e circunstâncias de sobrevenda. O RSI fornece insights sobre a força de uma tendência atual, bem como possíveis pontos de reversão, tornando-o útil para o timing inteligente de negociações. Sinais de reversão podem ser encontrados usando as leituras do RSI; a força da tendência pode ser validada; pontos de entrada e saída adequados podem ser encontrados; consequentemente, a precisão das estratégias de negociação é aprimorada.
Bandas de Bollinger
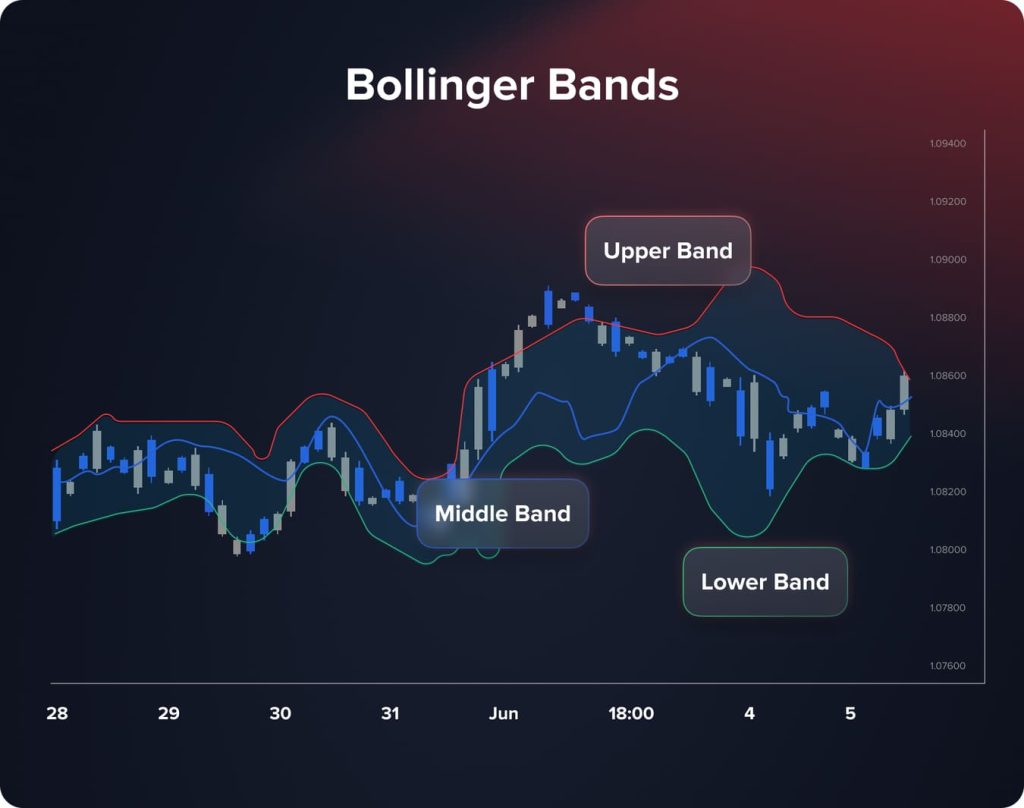
Geralmente uma MMS de 20 dias, as bandas de Bollinger consistem em três linhas apresentadas em um gráfico de preços: uma banda intermediária e uma banda superior e inferior, com dois desvios-padrão acima e abaixo da banda central. O crescimento e a contração das bandas dependem da volatilidade do mercado; elas se expandem em momentos de alta volatilidade e se contraem em momentos de baixa volatilidade. Tocar na banda inferior pode sugerir circunstâncias de sobrevenda; o preço pode estar sobremordido à medida que se aproxima da banda superior.
As Bandas de Bollinger auxiliam os traders a analisar a volatilidade e a encontrar prováveis pontos de reversão ou rompimento. O bom timing das negociações depende da capacidade dos traders de analisar a volatilidade do mercado, encontrar possíveis rompimentos e reversões de tendência e reconhecer posições de sobrecompra ou sobrevenda por meio da análise da interação entre o preço e as faixas.
Indicadores de volume
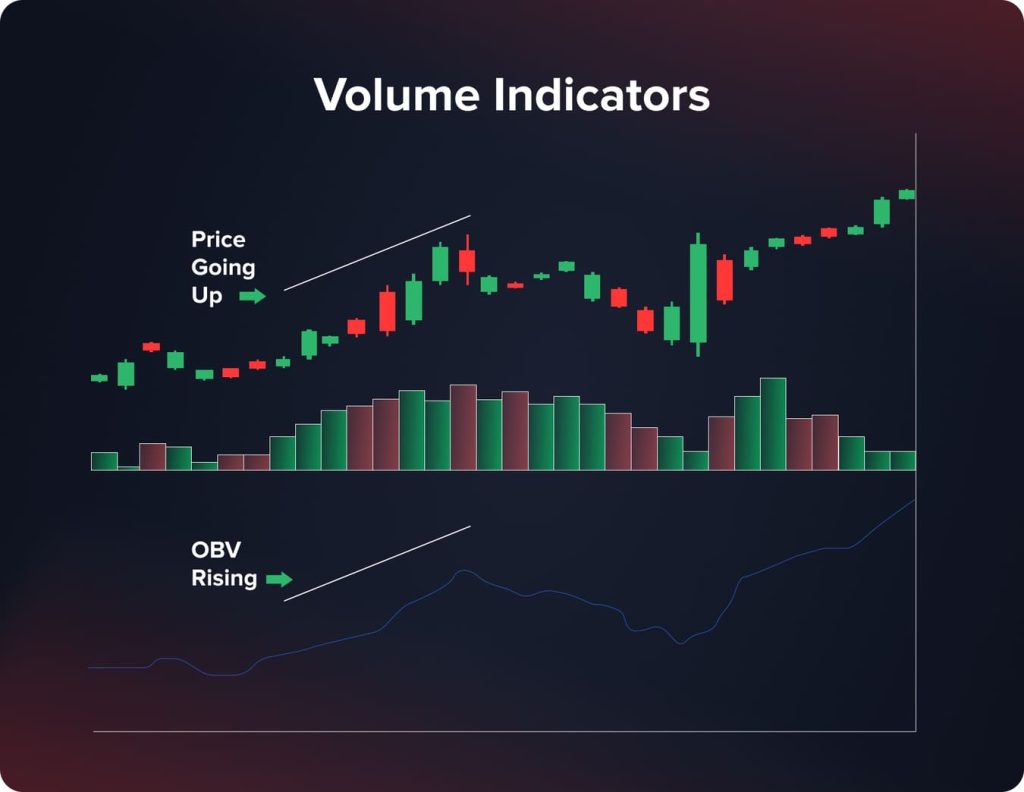
Por meio da análise do volume de um ativo vendido ao longo de um determinado período, os indicadores de volume ajudam a compreender a situação dos mercados. Ao aumentar o volume em dias de alta e diminuir em dias de baixa, o volume em balanço (OBV) mede a pressão de compra e venda, mostrando, assim, o fluxo total de volume.
Útil para avaliar a qualidade da execução de negociações, o Preço Médio Ponderado pelo Volume (VWAP) calcula o preço médio ponderado pelo volume total de transações. Embora a queda no volume possa indicar perda de momentum, o alto volume geralmente indica tendências fortes.
Oscilador Estocástico
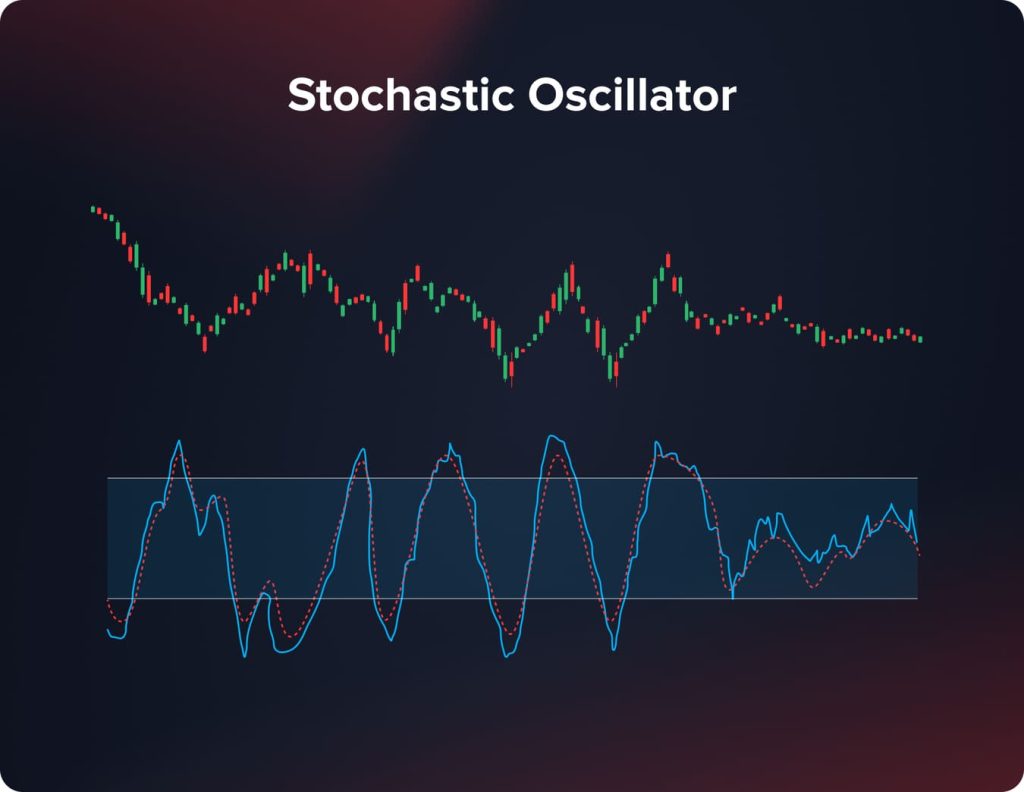
O Oscilador Estocástico incorpora indicadores de momentum para acompanhar os preços de fechamento dos ativos em relação à sua amplitude ao longo de um determinado período. Ele varia de 0 a 100, com leituras abaixo de 20 sugerindo circunstâncias de sobrevenda e leituras acima de 80 sugerindo condições de sobrecompra. Quando o indicador ultrapassa certos limites, ele sugere possíveis reversões de tendência. O Oscilador Estocástico auxilia na identificação de posições de sobrecompra e sobrevenda, cronometrando entradas e saídas com base em mudanças de momentum e validando sinais de outros indicadores. Entender o que impulsiona as oscilações de preço subjacentes ajuda os traders a decidir sobre movimentos de negociação mais precisos.
Níveis de Retração de Fibonacci
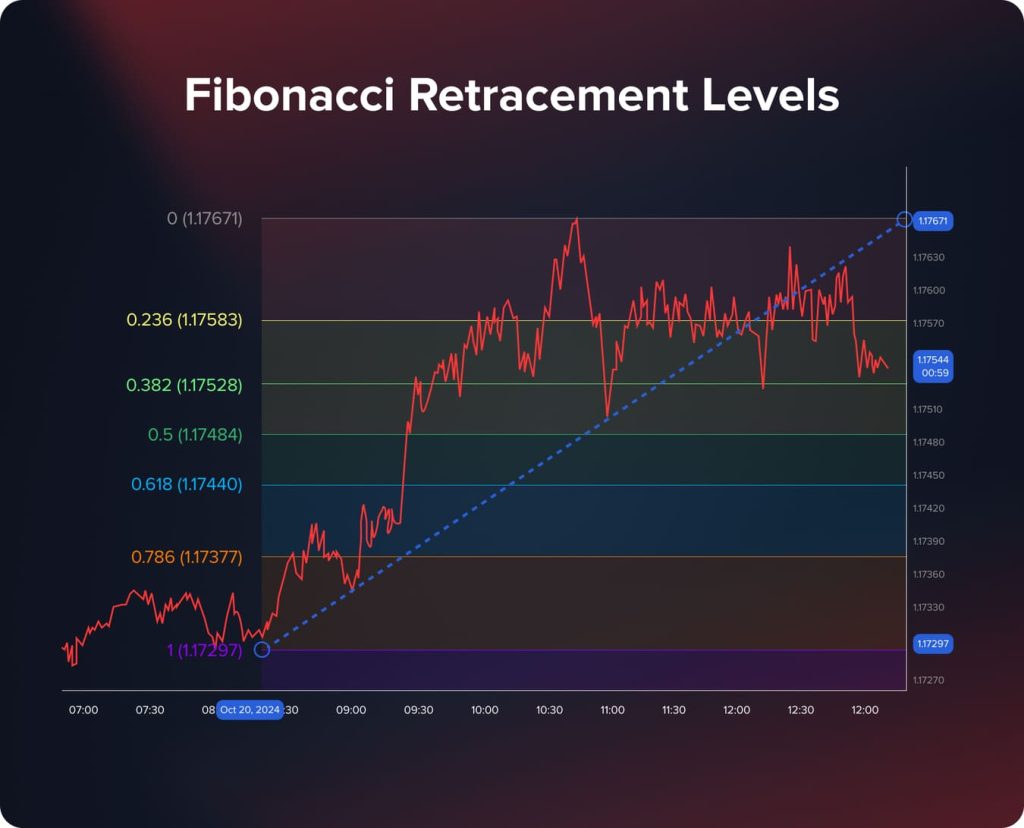
Níveis de Fibonacci São linhas horizontais que ilustram onde o suporte e a resistência têm maior probabilidade de ocorrer, com base em índices de Fibonacci significativos, como 23,6%, 38,2%, 50%, 61,8% e 78,6%. Esses níveis permitem que os traders projetem, dentro de uma tendência mais longa, o provável grau de recuo ou correção do mercado. Usando os índices de Fibonacci e a distância entre movimentos de preços significativos, os traders podem encontrar possíveis regiões de suporte e oposição. A inclusão dos níveis de Fibonacci nas estratégias de negociação melhora a eficácia da análise técnica, ajuda a prever correções e reversões de preços, planejar pontos de entrada e saída em mercados em movimento e melhora a precisão da pesquisa técnica.
Convergência e Divergência da Média Móvel
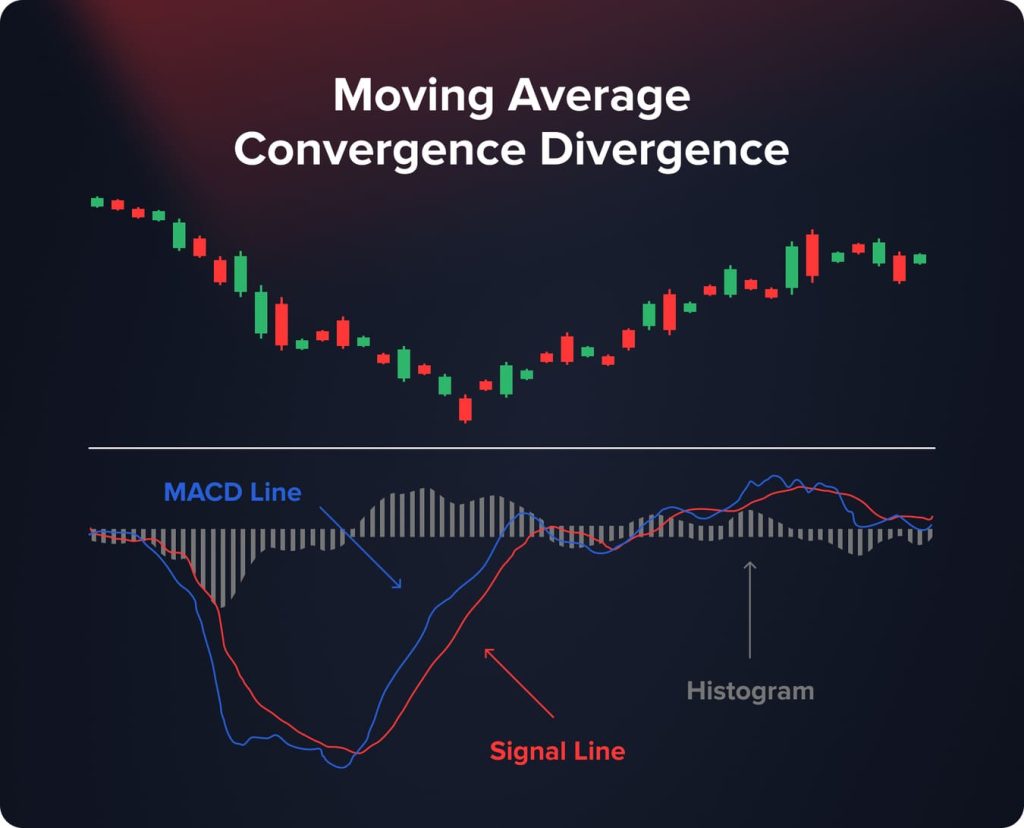
A Convergência e Divergência da Média Móvel, ou MACD, é um indicador amplamente utilizado que permite aos traders detectar mudanças no momentum e na tendência geral de uma ação. Ele contrasta a Média Móvel Exponencial (MME) de 12 períodos com a MME de 26 períodos de um ativo.
Ao procurar cruzamentos entre a linha MACD e a linha de sinal, os traders encontram possíveis sinais de compra e venda. Um cruzamento da linha MACD acima da linha de sinal pode indicar um momentum ascendente e uma possível oportunidade de compra. Por outro lado, quando a linha cai abaixo dela, pode indicar uma possível chance de venda e um momentum descendente. Analisar essas indicações ajuda os traders a decidir se devem entrar ou sair de posições com mais conhecimento.
Qual indicador é o mais preciso?
Encontrar a indicação mais precisa é uma dificuldade constante para os traders, pois nenhum instrumento consegue antecipar com exatidão as mudanças no mercado. Cada indicador tem vantagens diferentes e apresenta bom desempenho, dependendo de determinados métodos de negociação e circunstâncias de mercado. A precisão de um indicador geralmente depende de fatores como o período analisado, a volatilidade dos ativos e a natureza das tendências ou variações do mercado.
Para mercados que apresentam movimentos direcionais óbvios, por exemplo, indicadores de acompanhamento de tendências como MACD e Médias Móveis são mais confiáveis. Prever se a tendência continuará ou se reverterá ajuda os traders a capitalizar padrões de preços de longo prazo. Por outro lado, osciladores como o RSI e o Oscilador Estocástico podem fornecer sugestões mais precisas em mercados de amplitude ou lateralidade, identificando níveis de sobrecompra e sobrevenda.
Ao validar a força dos movimentos de preços, os indicadores de volume aumentam a precisão. Como demonstram maior confiança do mercado, uma variação de preços acompanhada de grande volume é geralmente percebida como mais significativa do que uma com baixo volume.
Confiar apenas em um indicador pode levar a sinais falsos, pois os indicadores interpretam dados de preços passados e não são preditores infalíveis de movimentos futuros. As condições de mercado podem mudar rapidamente, diminuindo a eficácia de um indicador.
Em última análise, o indicador mais preciso é aquele que se alinha à sua estratégia de negociação, se adapta ao ambiente de mercado atual e se mostrou eficaz por meio de sua própria análise. Combinar indicadores técnicos com uma gestão de risco sólida e, quando aplicável, análise fundamentalista, aumenta a probabilidade de tomar decisões de negociação bem informadas.
You may also like

MACD vs. RSI: Qual é melhor?
Os objetivos do trader e a situação do mercado determinarão qual MACD ou RSI ele deve usar. Para identificar reversões de tendência e avaliar sua força em um período médio, o MACD é perfeito. Ele se destaca por mostrar mudanças no momentum dentro de uma tendência. Por outro lado, o RSI é mais adequado para identificar situações de sobrecompra e sobrevenda, sendo, portanto, útil para cronometrar entradas e saídas, bem como para opções de negociação de curto prazo. Muitos traders consideram que a utilização combinada de ambos os indicadores oferece uma visão mais completa. O MACD melhora a confiabilidade do sinal de negociação, verificando as tendências identificadas pelo RSI. A combinação das vantagens do MACD e do RSI ajudará os traders a melhorar sua capacidade de tomar decisões de negociação inteligentes.
Quais indicadores os traders profissionais usam?
Para desenvolver estratégias de negociação lucrativas, traders profissionais utilizam dados de mercado, ferramentas sofisticadas de pesquisa e indicadores técnicos. Seu método geralmente consiste em desenvolver ferramentas adequadas a determinados estilos de negociação, mesclar análise técnica com elementos fundamentais para fornecer uma visão completa do mercado e combinar diversos indicadores para confirmar os sinais.
Indicadores técnicos são importantes, mas traders experientes costumam usar a análise fundamentalista para aprimorar suas decisões de negociação. Eles acompanham o humor do mercado, relatórios de lucros de empresas, divulgações de dados econômicos e eventos geopolíticos. Indicações técnicas combinadas com conhecimento fundamentalista ajudam a antecipar mudanças no mercado com mais precisão. Por exemplo, um sinal de alta de indicadores técnicos pode ser reforçado se a análise fundamentalista sugerir crescimento econômico positivo ou forte desempenho corporativo.
Profissionais frequentemente adaptam indicadores para se adequarem às suas estratégias de negociação específicas e aos ativos que negociam. Eles podem ajustar os períodos das Médias Móveis para capturar melhor as tendências em diferentes períodos ou modificar a sensibilidade do RSI para reduzir sinais falsos em mercados voláteis. A personalização de indicadores permite que eles respondam com mais eficácia às nuances do mercado e aumenta a relevância dos sinais gerados.
Traders experientes obtêm vantagem competitiva utilizando ferramentas e indicadores sofisticados. Um deles é a Nuvem de Ichimoku, uma indicação abrangente em um gráfico que fornece informações sobre a direção da tendência, níveis de suporte e resistência, momentum e possíveis sinais de negociação, permitindo que os traders avaliem rapidamente o sentimento geral do mercado e identifiquem possíveis rompimentos. Eles também utilizam pontos de pivô, que são derivados da soma das máximas, mínimas e preços de fechamento do dia anterior, para ajudar a identificar níveis cruciais de suporte e resistência para o dia de negociação atual, permitindo que traders experientes identifiquem níveis de preço onde o mercado pode sofrer oscilações significativas.
You may also like

Aspectos psicológicos e disciplina na negociação
Um bom day trading exige uma base psicológica sólida e uma atitude disciplinada, além de conhecimento técnico e bom uso de indicadores. Obstáculos emocionais como medo de perdas, ganância por lucros excessivos, overtrading causado pelo entusiasmo ou paralisia pela análise abundam entre os traders. Esses sentimentos podem distorcer o julgamento e levar a decisões precipitadas, independentemente de um plano de negociação bem definido. Superar esses obstáculos psicológicos exige disciplina, o que é realmente vital. Seguir uma estratégia de negociação estabelecida ajuda a tomar decisões imparciais baseadas em análises em vez de sentimentos.
Gerenciar expectativas e criar objetivos razoáveis ajuda a evitar a busca por metas inalcançáveis que podem causar frustração ou comportamento imprudente. Desenvolver resiliência emocional ajuda os traders a manter o foco no sucesso a longo prazo, manter a calma sob pressão e se recuperar rapidamente de erros.
Traders que identificam seus próprios vieses e fatores psicológicos podem desenvolver estratégias para atenuar seu impacto, programando pausas frequentes, praticando mindfulness ou mantendo um diário de negociações para revisar decisões e resultados. Em última análise, um método disciplinado e psicologicamente equilibrado aprimora o processo de tomada de decisão e ajuda muito a garantir o sucesso nas negociações regulares.
Conclusão
Tomar decisões inteligentes e rápidas nos mercados financeiros em constante mudança depende da escolha correta dos indicadores de day trading. Compreender e utilizar bem esses instrumentos pode ajudar os traders a aprimorar sua capacidade de gerenciar riscos, identificar as melhores oportunidades de negociação e prever flutuações de preços. O desempenho nas negociações pode ser bastante aprimorado pela combinação de diversos indicadores, sua modificação para atender a determinados estilos de negociação e a combinação com sólidas técnicas de gestão de risco. O sucesso no day trading depende de educação contínua, experiência e aplicação rigorosa de estratégias cuidadosamente planejadas.
FAQ
Como o desempenho depende da qualidade da inclusão de um indicador em um plano de negociação, considerando as circunstâncias do mercado e os estilos de negociação individuais, nenhum indicador é intrinsecamente o mais lucrativo. Muitas vezes, o sucesso resulta da integração de vários indicadores e de uma excelente gestão de risco, em vez de depender apenas de um único indicador.
Como eles fornecem aos traders informações visuais abrangentes sobre movimentos de preços e padrões em curtos períodos de tempo, o que os ajuda a fazer escolhas rápidas e informadas, os gráficos de velas são frequentemente considerados os melhores para day trading.
Sim, o day trading pode ser lucrativo, mas é difícil e cheio de riscos. O sucesso no day trading geralmente depende de aprendizado contínuo, prática e adesão a rigorosos padrões de gestão de risco. Antes de seguir carreira em tempo integral no day trading, você deve se informar adequadamente sobre os mercados e conversar com especialistas financeiros para entender os perigos.
Atualizado:
19 de dezembro de 2024

