Các nhà giao dịch trong ngày (day traders) khi giao dịch trên thị trường tài chính biến động mạnh cần sử dụng các chỉ báo phù hợp. Việc phân tích hành vi thị trường phụ thuộc rất nhiều vào các chỉ báo như Đường trung bình động (MA), RSI, MACD, Dải Bollinger, Chỉ báo khối lượng, Chỉ báo dao động ngẫu nhiên (STO) và Mức Fibonacci. Chúng hỗ trợ các nhà giao dịch trong việc phân tích dữ liệu khó, dự đoán biến động giá và xác định thời điểm vào lệnh và thoát lệnh lý tưởng. Bài viết này sẽ phân tích những công dụng, lợi ích độc đáo và cách áp dụng thành công các chỉ báo này vào kế hoạch giao dịch.
Danh sách các chỉ báo giao dịch trong ngày tốt nhất:
- Đường trung bình động
- Chỉ số sức mạnh tương đối
- Dải Bollinger
- Chỉ báo âm lượng
- Bộ dao động ngẫu nhiên
- Mức thoái lui Fibonacci
- Đường trung bình động hội tụ phân kỳ
Đường trung bình động
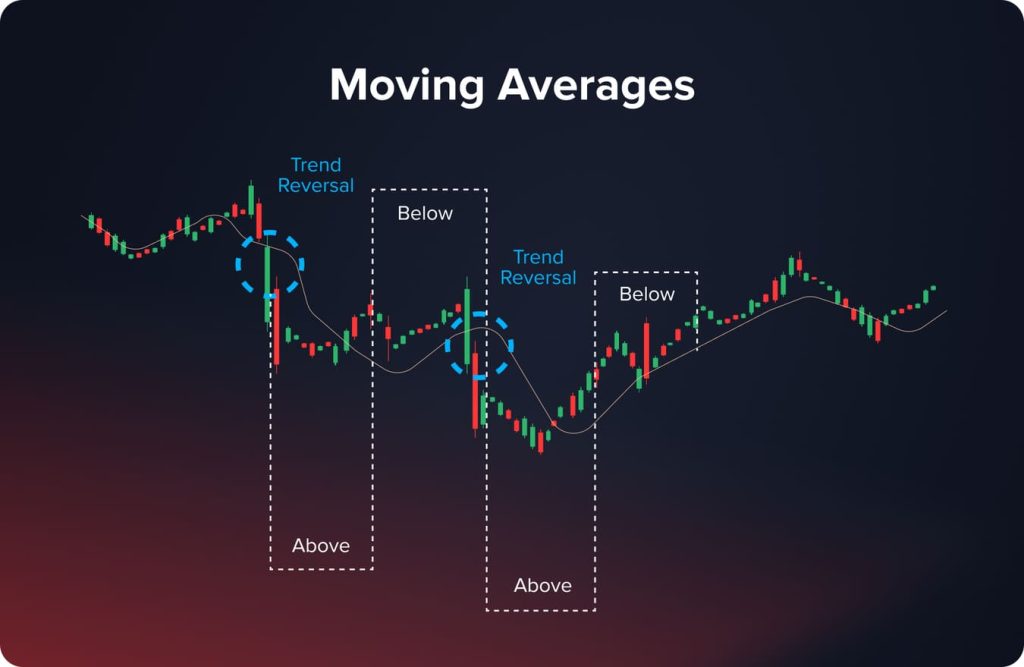
Các chỉ báo cơ bản, được gọi là đường trung bình động, có tác dụng làm mịn dữ liệu giá, từ đó xác định hướng đi của xu hướng. Bằng cách chạy giá trung bình của một chứng khoán trong một khoảng thời gian nhất định, chúng giúp các nhà giao dịch phát hiện xu hướng tăng hoặc giảm. Đường trung bình động đơn giản (SMA), ước tính giá trung bình trong một khoảng thời gian nhất định nhưng vẫn cho trọng số ngang bằng với tất cả các điểm dữ liệu, và Đường trung bình động hàm mũ (EMA), cho trọng số cao hơn đối với giá gần đây nhất, do đó tăng độ nhạy cảm với dữ liệu mới, là hai loại đường trung bình động chính.
Các mức hỗ trợ và kháng cự có thể được biểu diễn động bằng đường trung bình động. Khi giá giao dịch liên tục trên đường MA, điều này có thể báo hiệu một xu hướng tăng sắp tới; hành động giá bên dưới có thể chỉ ra một xu hướng giảm sắp tới. Việc kết hợp đường trung bình động 50 ngày và 200 ngày cho phép các nhà giao dịch phát hiện các điểm giao cắt tử thần giảm giá hoặc các điểm giao cắt vàng tăng giá.
Chỉ số sức mạnh tương đối
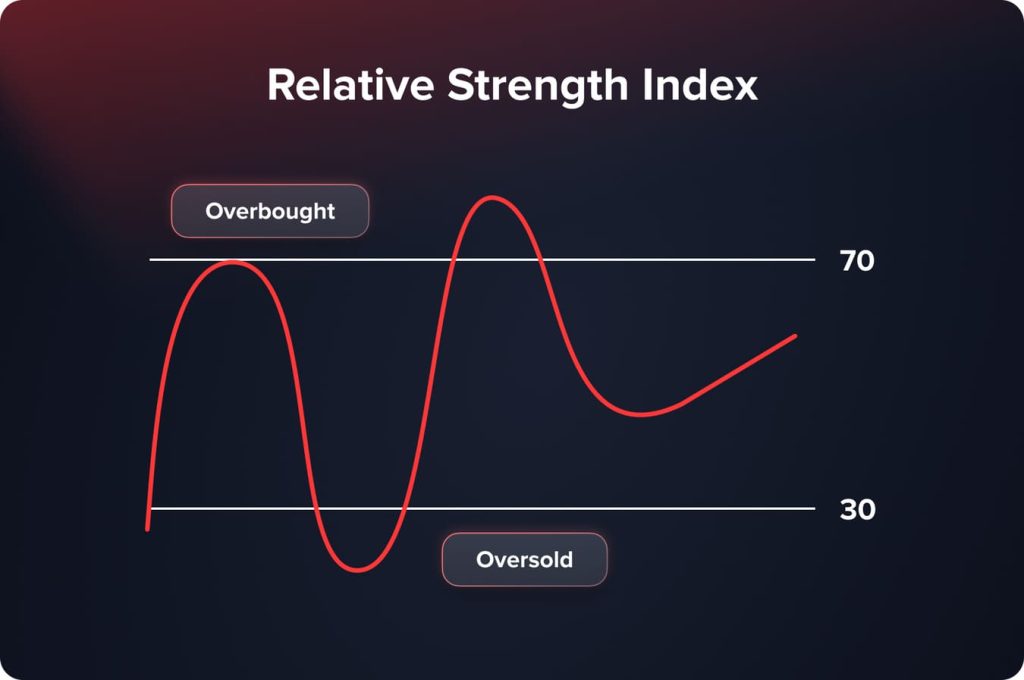
Đánh giá tốc độ và sự thay đổi của biến động giá trên thang điểm từ 0 đến 100, RSI là một chỉ báo dao động động lượng. Nó giúp xác định các điều kiện thị trường quá mua và quá bán. RSI cao hơn 70 cho thấy tình trạng quá mua – tức là tài sản đắt đỏ và cần điều chỉnh giá. RSI dưới 30 cho thấy tài sản rẻ, ngụ ý khả năng giá tăng và tình trạng quá bán. RSI cung cấp thông tin chi tiết về sức mạnh của xu hướng hiện tại cũng như các điểm đảo chiều tiềm năng, giúp ích cho việc xác định thời điểm giao dịch thông minh. Có thể tìm thấy tín hiệu đảo chiều bằng cách sử dụng chỉ số RSI; có thể xác nhận sức mạnh của xu hướng; có thể tìm thấy điểm vào và thoát lệnh phù hợp; do đó, độ chính xác của các chiến lược giao dịch được cải thiện.
Dải Bollinger
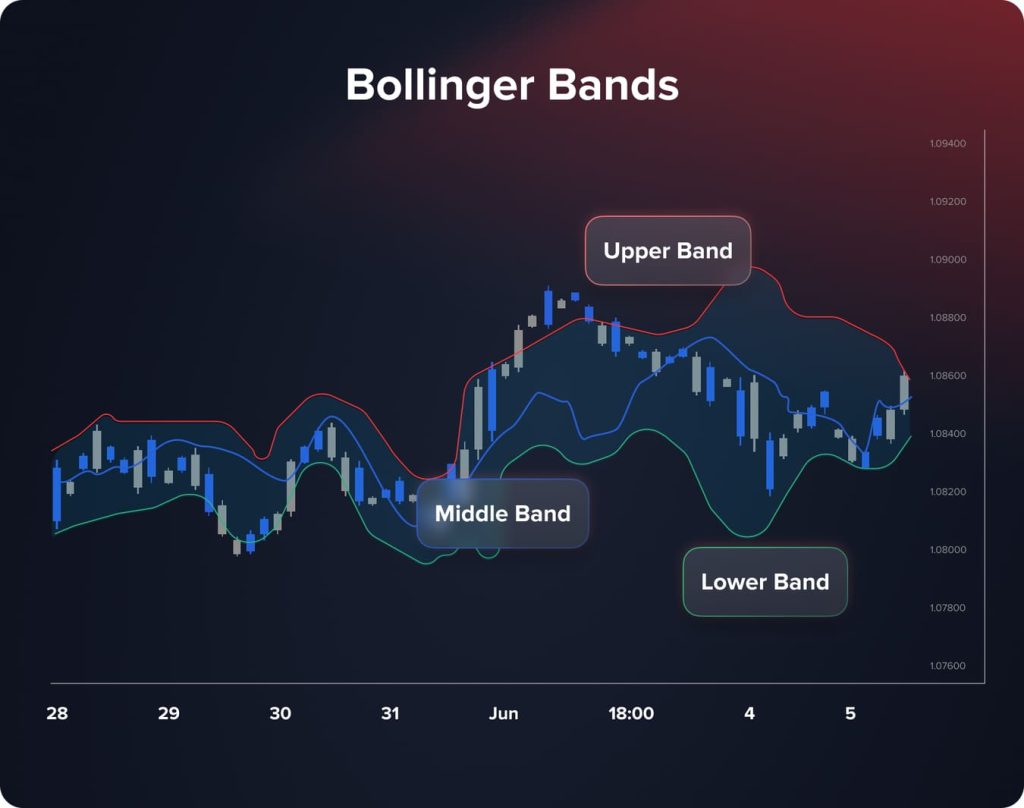
Thường là đường trung bình động 20 ngày (SMA 20 ngày), dải Bollinger bao gồm ba đường được biểu thị trên biểu đồ giá: một dải giữa, một dải trên và một dải dưới, tạo ra hai độ lệch chuẩn trên và dưới dải trung tâm. Sự tăng và giảm của các dải phụ thuộc vào biến động thị trường; chúng mở rộng trong thời kỳ biến động lớn và co lại trong thời kỳ biến động thấp. Việc chạm vào dải dưới có thể cho thấy tình trạng quá bán; giá có thể bị cắn quá mức khi tiếp cận dải trên.
Dải Bollinger hỗ trợ nhà giao dịch phân tích biến động và tìm ra các điểm đảo chiều hoặc đột phá tiềm năng. Thời điểm giao dịch tốt phụ thuộc vào khả năng phân tích biến động thị trường, tìm ra các điểm đột phá và đảo chiều xu hướng tiềm năng, cũng như nhận biết các vị thế quá mua hoặc quá bán bằng cách phân tích sự tương tác giữa giá và phạm vi.
Chỉ báo âm lượng
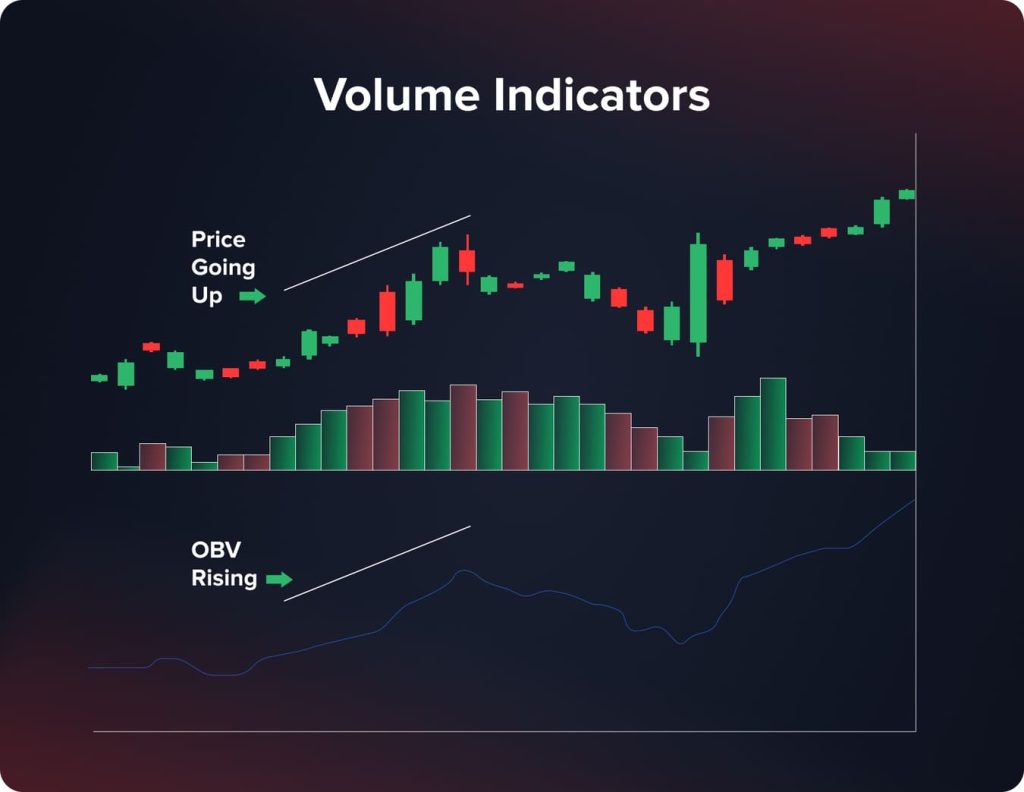
Bằng cách phân tích khối lượng giao dịch của một tài sản trong một khoảng thời gian nhất định, các chỉ báo khối lượng giúp người ta hiểu được trạng thái của thị trường. Bằng cách tăng khối lượng vào những ngày tăng và giảm vào những ngày giảm, chỉ báo khối lượng cân bằng (OBV) đo lường áp lực mua và bán, do đó thể hiện tổng khối lượng giao dịch.
Giá Trung bình Khối lượng (VWAP) hữu ích trong việc đánh giá chất lượng thực hiện giao dịch, tính toán giá trung bình được tính theo tổng khối lượng giao dịch. Mặc dù khối lượng giảm có thể chỉ ra động lực giảm, nhưng khối lượng cao thường hỗ trợ xu hướng mạnh.
Bộ dao động ngẫu nhiên
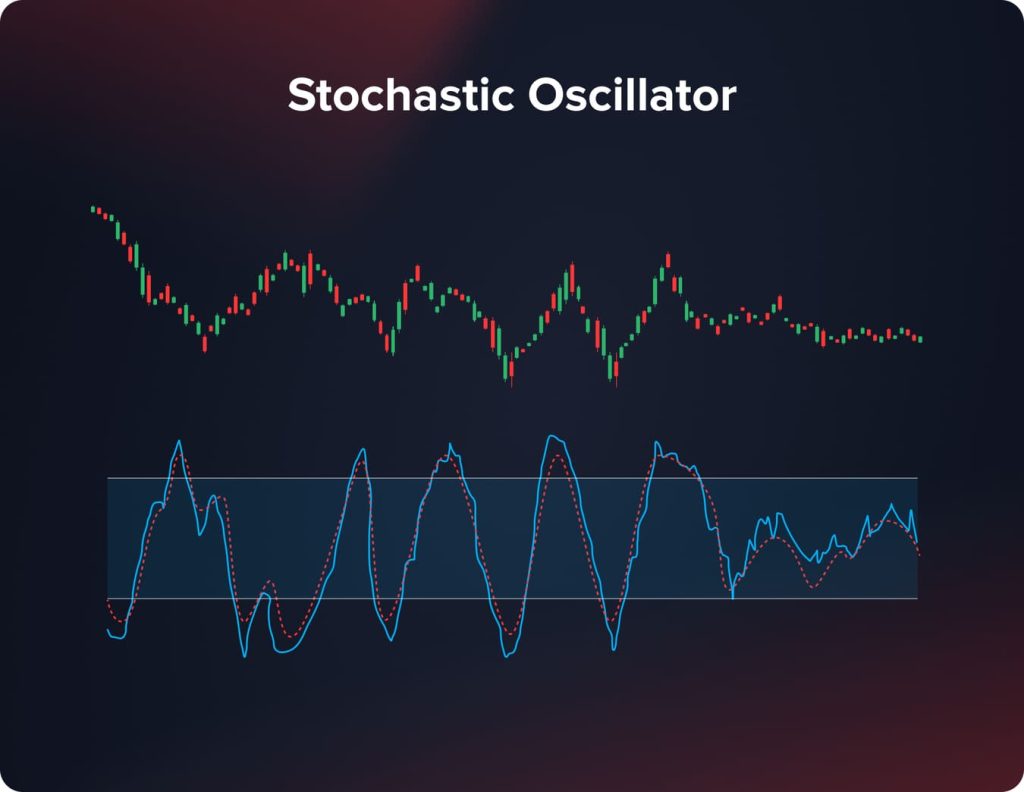
Chỉ báo dao động ngẫu nhiên Stochastic Oscillator kết hợp các chỉ báo động lượng để theo dõi giá đóng cửa của tài sản so với biên độ dao động của chúng trong một khoảng thời gian nhất định. Chỉ báo dao động từ 0 đến 100, với các chỉ số dưới 20 cho thấy tình trạng quá bán và các chỉ số trên 80 có thể cho thấy tình trạng quá mua. Khi chỉ báo vượt qua một số ngưỡng nhất định, nó sẽ gợi ý khả năng đảo chiều xu hướng. Chỉ báo dao động ngẫu nhiên hỗ trợ xác định các vị thế quá mua và quá bán, xác định thời điểm vào và thoát lệnh dựa trên sự thay đổi động lượng, và xác nhận tín hiệu từ các chỉ báo khác. Việc hiểu rõ nguyên nhân dẫn đến biến động giá cơ bản sẽ giúp các nhà giao dịch quyết định các động thái giao dịch chính xác hơn.
Mức thoái lui Fibonacci
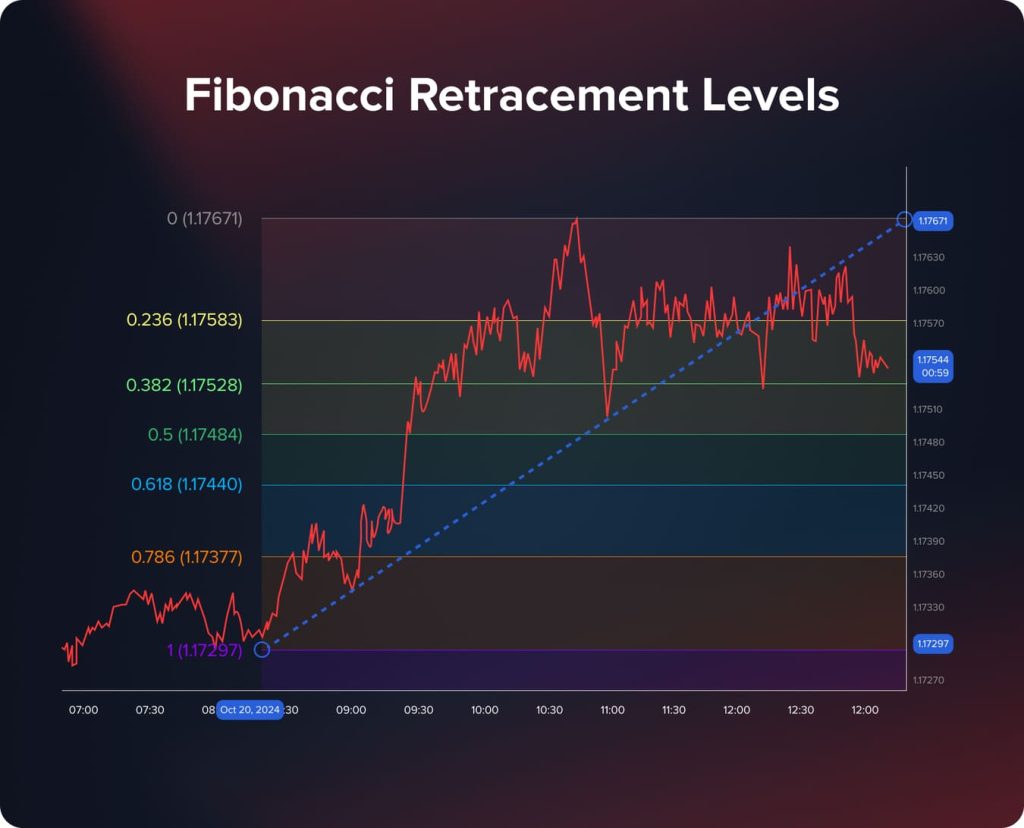
Mức Fibonacci là các đường ngang minh họa nơi hỗ trợ và kháng cự có khả năng xảy ra cao nhất dựa trên các tỷ lệ Fibonacci quan trọng như 23,6%, 38,2%, 50%, 61,8% và 78,6%. Các mức này cho phép nhà giao dịch dự đoán, trong một xu hướng dài hạn, mức độ có thể xảy ra của một đợt thoái lui hoặc điều chỉnh thị trường. Sử dụng tỷ lệ Fibonacci và khoảng cách giữa các biến động giá đáng chú ý, nhà giao dịch có thể tìm thấy các vùng hỗ trợ và kháng cự tiềm năng. Việc đưa các mức Fibonacci vào chiến lược giao dịch giúp cải thiện hiệu quả của phân tích kỹ thuật, giúp dự đoán các đợt điều chỉnh và đảo chiều giá, lên kế hoạch cho các điểm vào và thoát lệnh trên các thị trường biến động, đồng thời cải thiện độ chính xác của nghiên cứu kỹ thuật.
Đường trung bình động hội tụ phân kỳ
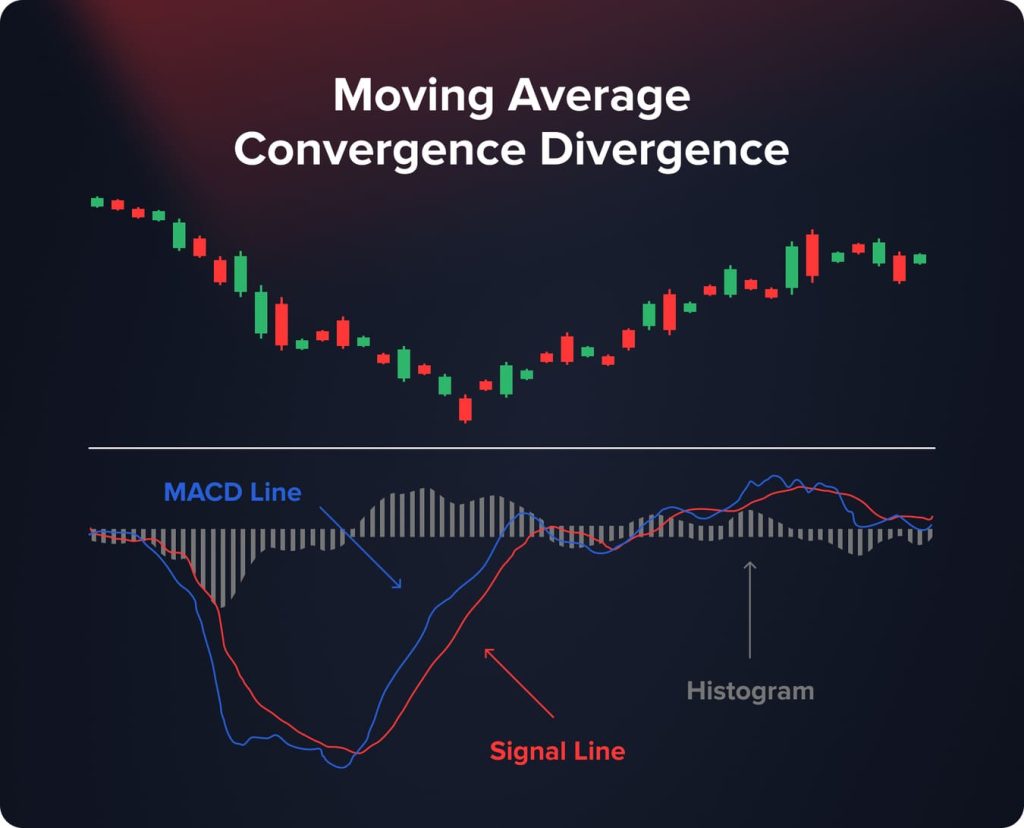
Đường Trung bình Động Hội tụ Phân kỳ, hay MACD, là một chỉ báo được sử dụng rộng rãi, cho phép các nhà giao dịch phát hiện những thay đổi trong động lượng và xu hướng chung của một cổ phiếu. Nó tương phản với Đường Trung bình Động Hàm mũ (EMA) 12 kỳ với Đường EMA 26 kỳ của một tài sản.
Khi tìm kiếm các điểm giao cắt giữa đường MACD và đường tín hiệu, các nhà giao dịch sẽ tìm thấy các tín hiệu mua và bán khả thi. Đường MACD cắt lên trên đường tín hiệu có thể cho thấy đà tăng và cơ hội mua tiềm năng. Ngược lại, khi đường MACD giảm xuống dưới, nó có thể cho thấy cơ hội bán tiềm năng và đà giảm đang tăng. Việc phân tích các chỉ báo này giúp các nhà giao dịch quyết định nên tham gia hay rời khỏi vị thế với nhiều kiến thức hơn.
Chỉ số nào chính xác nhất?
Việc tìm kiếm chỉ báo chính xác nhất luôn là một thách thức đối với các nhà giao dịch, bởi không một công cụ nào có thể dự đoán chính xác những thay đổi trên thị trường. Mỗi chỉ báo đều có những ưu điểm khác nhau và hoạt động hiệu quả tùy thuộc vào các phương pháp giao dịch và hoàn cảnh thị trường nhất định. Độ chính xác của một chỉ báo thường phụ thuộc vào các yếu tố như khoảng thời gian phân tích, tính biến động của tài sản, và xu hướng hoặc bản chất dao động của thị trường.
Đối với các thị trường thể hiện chuyển động theo hướng rõ ràng, ví dụ, các chỉ báo theo xu hướng như MACD và Đường trung bình động đáng tin cậy hơn. Việc dự đoán xu hướng sẽ tiếp tục hay đảo chiều giúp các nhà giao dịch tận dụng các mô hình giá dài hạn. Mặt khác, các chỉ báo dao động như RSI và Stochastic Oscillator có thể cung cấp các gợi ý chính xác hơn trong thị trường dao động trong phạm vi hoặc đi ngang bằng cách phát hiện các mức quá mua và quá bán.
Thông qua việc xác thực sức mạnh của biến động giá, các chỉ báo khối lượng sẽ tăng độ chính xác. Vì nó thể hiện sự tự tin của thị trường cao hơn, nên sự thay đổi giá đi kèm với khối lượng lớn thường được coi là có ý nghĩa hơn so với sự thay đổi có khối lượng thấp.
Việc chỉ dựa vào một chỉ báo có thể dẫn đến tín hiệu sai lệch, vì các chỉ báo diễn giải dữ liệu giá trong quá khứ và không phải là yếu tố dự báo chính xác cho biến động trong tương lai. Điều kiện thị trường có thể thay đổi nhanh chóng, làm giảm hiệu quả của một chỉ báo.
Cuối cùng, chỉ báo chính xác nhất là chỉ báo phù hợp với chiến lược giao dịch của bạn, phù hợp với môi trường thị trường hiện tại và đã được chứng minh hiệu quả thông qua phân tích của chính bạn. Việc kết hợp các chỉ báo kỹ thuật với quản lý rủi ro hợp lý và, nếu có thể, phân tích cơ bản, sẽ tăng khả năng đưa ra quyết định giao dịch sáng suốt.
Bạn cũng có thể thích


Iva Kalatozishvili
September 2, 2024
MACD so với RSI: Chỉ báo nào tốt hơn?
Mục tiêu của nhà giao dịch và tình hình thị trường sẽ quyết định nên sử dụng chỉ báo MACD hay RSI nào. Để phát hiện sự đảo chiều xu hướng và đánh giá sức mạnh xu hướng trong một khoảng thời gian trung hạn, MACD là lựa chọn hoàn hảo. Nó thể hiện rõ những thay đổi về động lượng trong một xu hướng. Ngược lại, RSI phù hợp hơn để xác định các tình huống quá mua và quá bán, do đó rất hữu ích cho việc xác định thời điểm vào và thoát lệnh cũng như cho các giao dịch ngắn hạn. Nhiều nhà giao dịch nhận thấy rằng việc sử dụng kết hợp cả hai chỉ báo mang lại bức tranh toàn cảnh hơn. MACD cải thiện độ tin cậy của tín hiệu giao dịch bằng cách xác minh các xu hướng mà RSI xác định. Việc kết hợp các ưu điểm của MACD và RSI sẽ giúp nhà giao dịch nâng cao khả năng đưa ra quyết định giao dịch thông minh.
Các nhà giao dịch chuyên nghiệp sử dụng chỉ báo nào?
Để phát triển các chiến lược giao dịch sinh lời, các nhà giao dịch chuyên nghiệp sử dụng dữ liệu thị trường, các công cụ nghiên cứu tinh vi và các chỉ báo kỹ thuật. Phương pháp của họ thường bao gồm việc phát triển các công cụ phù hợp với một số phong cách giao dịch nhất định, kết hợp phân tích kỹ thuật với các yếu tố cơ bản để cung cấp bức tranh toàn cảnh thị trường, và kết hợp nhiều chỉ báo để xác nhận tín hiệu.
Các chỉ báo kỹ thuật rất quan trọng, nhưng các nhà giao dịch chuyên nghiệp thường sử dụng phân tích cơ bản để cải thiện quyết định giao dịch của mình. Họ theo dõi tâm lý thị trường, báo cáo thu nhập doanh nghiệp, dữ liệu kinh tế và các sự kiện địa chính trị. Các chỉ báo kỹ thuật kết hợp với kiến thức cơ bản sẽ giúp nhà đầu tư dự đoán chính xác hơn những thay đổi trên thị trường. Ví dụ, tín hiệu tăng giá từ các chỉ báo kỹ thuật có thể được củng cố nếu phân tích cơ bản cho thấy tăng trưởng kinh tế tích cực hoặc hiệu suất doanh nghiệp mạnh mẽ.
Các chuyên gia thường điều chỉnh các chỉ báo cho phù hợp với chiến lược giao dịch cụ thể và tài sản họ giao dịch. Họ có thể điều chỉnh chu kỳ của Đường trung bình động để nắm bắt xu hướng tốt hơn trong các khung thời gian khác nhau hoặc điều chỉnh độ nhạy của RSI để giảm tín hiệu sai trong các thị trường biến động. Việc tùy chỉnh các chỉ báo cho phép họ phản ứng hiệu quả hơn với các sắc thái thị trường và nâng cao tính phù hợp của các tín hiệu được tạo ra.
Các nhà giao dịch chuyên nghiệp có được lợi thế cạnh tranh bằng cách sử dụng các công cụ và chỉ báo tinh vi. Một trong số đó là Đám mây Ichimoku, một chỉ báo toàn diện trên một biểu đồ, cung cấp thông tin về hướng xu hướng, mức hỗ trợ và kháng cự, động lượng và các tín hiệu giao dịch tiềm năng, từ đó cho phép nhà giao dịch nhanh chóng đánh giá tâm lý chung của thị trường và xác định các điểm đột phá tiềm năng. Họ cũng sử dụng các điểm xoay, được tính bằng cách cộng giá cao nhất, thấp nhất và giá đóng cửa của ngày hôm trước, để giúp xác định các mức hỗ trợ và kháng cự quan trọng cho ngày giao dịch hiện tại, cho phép các nhà giao dịch lành nghề xác định các mức giá mà thị trường có thể trải qua những biến động đáng kể.
Bạn cũng có thể thích


Vitaly Makarenko
June 10, 2024
Các khía cạnh tâm lý và kỷ luật trong giao dịch
Giao dịch trong ngày hiệu quả đòi hỏi một nền tảng tâm lý vững chắc và thái độ kỷ luật, bên cạnh kiến thức kỹ thuật và sử dụng chỉ báo tốt. Những rào cản cảm xúc như sợ thua lỗ, tham lam lợi nhuận quá mức, giao dịch quá mức do quá nhiệt tình, hoặc tê liệt do phân tích rất phổ biến đối với các nhà giao dịch. Những cảm xúc này có thể làm sai lệch phán đoán và dẫn đến những quyết định vội vàng bất chấp một kế hoạch giao dịch được xác định rõ ràng. Vượt qua những rào cản tâm lý này đòi hỏi tính kỷ luật, điều này thực sự quan trọng. Việc tuân thủ chính xác một chiến lược giao dịch đã được thiết lập sẽ giúp người giao dịch đưa ra quyết định khách quan dựa trên phân tích thay vì cảm tính.
Quản lý kỳ vọng và đặt ra các mục tiêu hợp lý giúp tránh theo đuổi những mục tiêu vượt ngoài tầm với, có thể gây ra sự thất vọng hoặc hành vi liều lĩnh. Xây dựng khả năng phục hồi cảm xúc giúp các nhà giao dịch tập trung vào thành công lâu dài, giữ bình tĩnh dưới áp lực và nhanh chóng phục hồi sau những sai lầm.
Các nhà giao dịch nhận diện được thiên kiến và các yếu tố tâm lý của bản thân có thể xây dựng các chiến lược để giảm thiểu tác động của chúng bằng cách sắp xếp thời gian nghỉ ngơi thường xuyên, thực hành chánh niệm hoặc duy trì nhật ký giao dịch để xem xét các quyết định và kết quả. Cuối cùng, một phương pháp kỷ luật và cân bằng về mặt tâm lý sẽ cải thiện quá trình ra quyết định và góp phần đáng kể vào việc đảm bảo thành công giao dịch thường xuyên.
Phần kết luận
Việc đưa ra quyết định thông minh và nhanh chóng trên thị trường tài chính thường xuyên biến động phụ thuộc vào việc lựa chọn đúng các chỉ báo giao dịch trong ngày. Hiểu rõ và sử dụng tốt các công cụ này có thể giúp các nhà giao dịch cải thiện khả năng quản lý rủi ro, nhận diện các cơ hội giao dịch tốt nhất và dự đoán biến động giá. Hiệu suất giao dịch có thể được cải thiện đáng kể bằng cách kết hợp nhiều chỉ báo, điều chỉnh chúng để phù hợp với các phong cách giao dịch nhất định và kết hợp chúng với các kỹ thuật quản lý rủi ro vững chắc. Thành công của giao dịch trong ngày phụ thuộc vào việc học tập liên tục, kinh nghiệm và áp dụng nghiêm ngặt các chiến lược được lên kế hoạch cẩn thận.

