
Os padrões de gráfico continuam sendo um dos conjuntos de ferramentas mais eficazes disponíveis para os traders em 2026. Isso ocorre porque, mesmo com o advento do trading algorítmico, sinais de negociação de IA e outros indicadores, o comportamento do mercado ainda é impulsionado pela psicologia, liquidez do mercado e estrutura do mercado. Ao reconhecer esses padrões de mercado, os traders podem prever e lucrar com os movimentos do mercado.
Este artigo cobre 50 padrões de gráfico chave, explica como eles se formam e mostra como podem ser negociados em condições reais de mercado. Tanto os traders de ações, criptomoedas, forex quanto de índices podem se beneficiar ao entender esses padrões de gráfico.
Resumo: Folha de Dicas sobre Padrões de Gráficos
| Padrão | Categoria | Viés | Sinal Chave | |
| 1 | Cabeça & Ombros | Reversão | Baixista | Quebra da linha de pescoço |
| 2 | Inverso H&O | Reversão | Altista | Quebra da linha de pescoço |
| 3 | Topo Duplo | Reversão | Baixista | Quebra de suporte |
| 4 | Fundo Duplo | Reversão | Altista | Quebra de resistência |
| 5 | Topo Triplo | Reversão | Baixista | Quebra da linha de pescoço |
| 6 | Fundo Triplo | Reversão | Altista | Quebra da linha de pescoço |
| 7 | Topo Arredondado | Reversão | Baixista | Quebra de suporte |
| 8 | Fundo Arredondado | Reversão | Altista | Quebra de resistência |
| 9 | Reversão de Ilha | Reversão | Ambos | Gap oposto |
| 10 | Reversão em V | Reversão | Ambos | Reversão acentuada |
| 11 | Bandeira de Alta | Continuação | Altista | Quebra da bandeira |
| 12 | Bandeira de Baixa | Continuação | Baixista | Quebra da bandeira |
| 13 | Penante de Alta | Continuação | Altista | Quebra do penante |
| 14 | Penante de Baixa | Continuação | Baixista | Quebra do penante |
| 15 | Triângulo Ascendente | Continuação | Altista | Quebra de resistência |
| 16 | Triângulo Descendente | Continuação | Baixista | Quebra de suporte |
| 17 | Triângulo Simétrico | Continuação | Neutro | Quebra direcional |
| 18 | Retângulo | Continuação | Baseado em tendência | Quebra de intervalo |
| 19 | Canal Ascendente | Continuação | Altista | Quebra do canal |
| 20 | Canal Descendente | Continuação | Baixista | Quebra do canal |
| 21 | Taça & Alça | Quebra | Altista | Quebra da alça |
| 22 | Taça Inversa & Alça | Quebra | Baixista | Quebra da alça |
| 23 | Compressão de Volatilidade | Volatilidade | Neutro | Expansão |
| 24 | Bobina de Compressão | Volatilidade | Neutro | Quebra |
| 25 | Quebra de Intervalo | Quebra | Ambos | Quebra de intervalo |
| 26 | Megafone | Volatilidade | Ambos | Quebra de expansão |
| 27 | Caminho Parabólico | Volatilidade | Extremo | Exaustão |
| 28 | Gaps | Quebra | Ambos | Manter/preencher gap |
| 29 | Gartley | Harmônico | Reversão | Ponto D |
| 30 | Morcego | Harmônico | Reversão | Retração de 88,6% |
| 31 | Borboleta | Harmônico | Reversão | Zona de extensão |
| 32 | Caranguejo | Harmônico | Reversão | 161,8% ext |
| 33 | Tubarão | Harmônico | Reversão | Ponto extremo |
| 34 | Onda Wolfe (Bull) | Harmônico | Altista | Onda 5 |
| 35 | Onda Wolfe (Bear) | Harmônico | Baixista | Onda 5 |
| 36 | HH & HL | Estrutura | Altista | Pullback hold |
| 37 | LH & LL | Estrutura | Baixista | Rejeição de rally |
| 38 | BOS | Estrutura | Direcional | Quebra de swing |
| 39 | ChoCH | Estrutura | Reversão | Estrutura falhada |
| 40 | Alturas Iguais | Liquidez | Reversão | Agrabamento de liquidez |
| 41 | Baixas Iguais | Liquidez | Reversão | Varredura de liquidez |
| 42 | Varredura de Liquidez | Liquidez | Reversão | Incursão de stop |
| 43 | Reversão de Stop-Hunt | Liquidez | Reversão | Rejeição acentuada |
| 44 | Falso Rompimento | Liquidez | Reversão | Rompimento falhado |
| 45 | Bump & Run | Comportamental | Reversão | Rompimento de linha de tendência |
| 46 | Quasimodo | Comportamental | Reversão | Máxima inferior |
| 47 | Três Impulsos | Comportamental | Reversão | 3º impulso |
| 48 | Dead Cat Bounce | Comportamental | Baixista | Retração fraca |
| 49 | Shakeout | Comportamental | Reversão | Varredura de stop |
| 50 | Onda de Elliott | Comportamental | Tendência | Onda de impulso |
O que são Padrões de Gráficos?
Um padrão gráfico é uma formação reconhecível criada pelos movimentos de preço de um ativo em um gráfico. Esses padrões são um resultado dos comportamentos humanos associados ao medo, ganância, pressões de venda e compra dentro dos mercados financeiros. Essas ações, no entanto, são repetitivas e eventualmente criam padrões visuais que os traders podem interpretar e dos quais podem se beneficiar.
Por exemplo, estudos mostraram que o padrão de cabeça e ombros tem uma taxa de sucesso de até 89% após uma confirmação. Por outro lado, fundos duplos e triângulos ascendentes têm uma taxa de sucesso de 80%.
Portanto, os traders podem confiar em padrões gráficos para:
- Determine possíveis reversões ou extensões de tendências
- Prever possíveis metas de preço
- Entender a psicologia do mercado por trás dos movimentos de preços
- Tomar uma decisão informada do ponto de vista da gestão de riscos
Embora os padrões de gráfico em si não sejam ferramentas de previsão perfeitas, quando combinados com sinais de confirmação, eles melhoram as chances de negociações bem-sucedidas.
Como Usar Padrões de Gráficos Corretamente
Os padrões de gráficos sozinhos não podem ser confiáveis. Pesquisas indicam que uma combinação de padrões de gráficos e outros indicadores, RSI ou MACD, pode melhorar a precisão em até 31%, e uma quebra é muito mais provável se o volume estiver acima da média em pelo menos 50%. Portanto, os traders devem combinar outras confluências para filtrar quaisquer sinais falsos fornecidos por esses padrões de gráficos. Outras confluências incluem:
1. Confirmação Primeiro: Não negocie apenas com base na formação de um padrão. Você deve esperar por uma confirmação de preço antes de tomar qualquer ação de compra ou venda. Por exemplo, ao usar o padrão de rompimento, você deve esperar até que o preço feche acima do ponto de rompimento.
2. Entenda a Tendência e o Contexto: Padrões têm um bom desempenho quando estão alinhados com a principal tendência de mercado. Um padrão de alta em um mercado em alta terá um desempenho melhor em comparação com um mercado em baixa. Além disso, um padrão de reversão, seja em uma tendência de baixa ou de alta, tem uma boa chance de se concretizar se você esperar pela confirmação.
3. Análise de Volume: Uma vez que o volume pode frequentemente confirmar padrões, ele se torna um elemento essencial do seu trading. Um rompimento com volume forte será mais confiável do que um rompimento com volume baixo.
4. Escolha o intervalo de tempo certo: Os sinais em intervalos de tempo maiores são mais credíveis do que aqueles em intervalos de tempo menores. Por exemplo, um padrão de gráfico no intervalo diário é mais confiável do que em um gráfico de 4 horas, que por sua vez é mais forte do que aqueles em intervalos de tempo menores.
5. Gerenciar risco: As ordens de stop loss devem ser colocadas em áreas onde o padrão falhará. Mesmo os padrões mais fortes podem às vezes falhar; portanto, você deve proteger seu dinheiro.
Como Esta Lista Está Estruturada
Esses padrões são colocados em categorias para torná-los mais fáceis de aprender, entender e aplicar:
- Padrões de Reversão de Tendência: Indicam possíveis reversões de tendências predominantes. Eles incluem Cabeça e Ombros, Cabeça e Ombros Invertido, Topo Duplo, Fundo Duplo, Topo Triplo, Fundo Triplo, Topo Arredondado, Fundo Arredondado, Formação de Alargamento, Cunha Descendente (Contexto de Reversão).
- Padrões de Continuação de Tendência: Indicam a continuação de uma tendência predominante. Eles incluem Bandeira de Alta, Bandeira de Baixa, Penante de Alta, Penante de Baixa, Triângulo Ascendente, Triângulo Descendente, Triângulo Simétrico, Retângulo (Continuação de Faixa), Canal Ascendente e Canal Descendente.
- Padrões de rompimento e volatilidade: Ilustram compressão e possíveis grandes movimentos. Eles incluem o Padrão de Xícara com Alça, Padrão de Xícara Inversa com Alça, Compressão de Volatilidade, Compressão de Preços, Rompimento de Faixa de Bobina, Formação de Amplitude (Padrão de Megafone), Padrão de Curva Parabólica e Padrão de Lacunas.
- Padrões Geométricos Harmônicos e Avançados: Estes são arranjos precisos para traders experientes. Eles incluem o Padrão Gartley, Padrão Bat, Padrão Butterfly, Padrão Crab, Padrão Shark, Wolfe Wave (Bullish) e Wolfe Wave (Bearish).
- Estrutura de Mercado e Padrões de Liquidez: Eles oferecem insights sobre a negociação institucional. Eles incluem Altas Superiores e Baixas Superiores, Altas Inferiores e Baixas Inferiores, Quebra de Estrutura, Mudança de Caráter, Alturas Iguais, Baixas Iguais, Liquidez Sweep Stop-Hunt Reversal, e Falsa Quebra.
- Padrões Especializados e Comportamentais: Padrões menos comuns que expõem a psicologia de mercado. Eles incluem o Padrão Bump and Run, o Padrão Quasimodo, o Padrão Three Drives, o Padrão Dead Cat Bounce, o Padrão Shakeout e o Padrão Elliott Wave.
Cada explicação de padrão abaixo mostra uma breve descrição e uso prático para ajudá-lo a começar imediatamente.
1. Padrão Head & Shoulders
O padrão Cabeça e Ombros é um dos padrões de reversão de tendência mais confiáveis na análise técnica. Ele geralmente ocorre após uma grande alta, quando uma grande venda está prestes a começar devido a menos compradores e mais vendedores começando a surgir nos mercados. Simboliza uma transição de controle de compradores para vendedores.
Como o Padrão Cabeça e Ombros se Forma
O padrão consiste em quatro componentes distintos:
- Ombro Esquerdo: O preço de um ativo sobe e recua, resultando no primeiro pico. Essa ação de preço significa uma forte pressão de compra.
- Cabeça: Quando o preço se move acima do ombro esquerdo, ele cria um pico mais alto, chamado de Cabeça. Uma correção mais profunda se segue a isso e mostra a exaustão final dos touros, onde as forças de compra empurram o preço para um novo máximo.
- Ombro Direito: Para formar o ombro direito, o preço faz mais uma tentativa de subir, mas não consegue ultrapassar o pico da cabeça, sinalizando fraqueza.
- Decote: Um nível de suporte onde os dois mínimos do recuo se encontram. Este nível é um nível crucial de confirmação. Uma quebra do decote indica domínio dos vendedores.
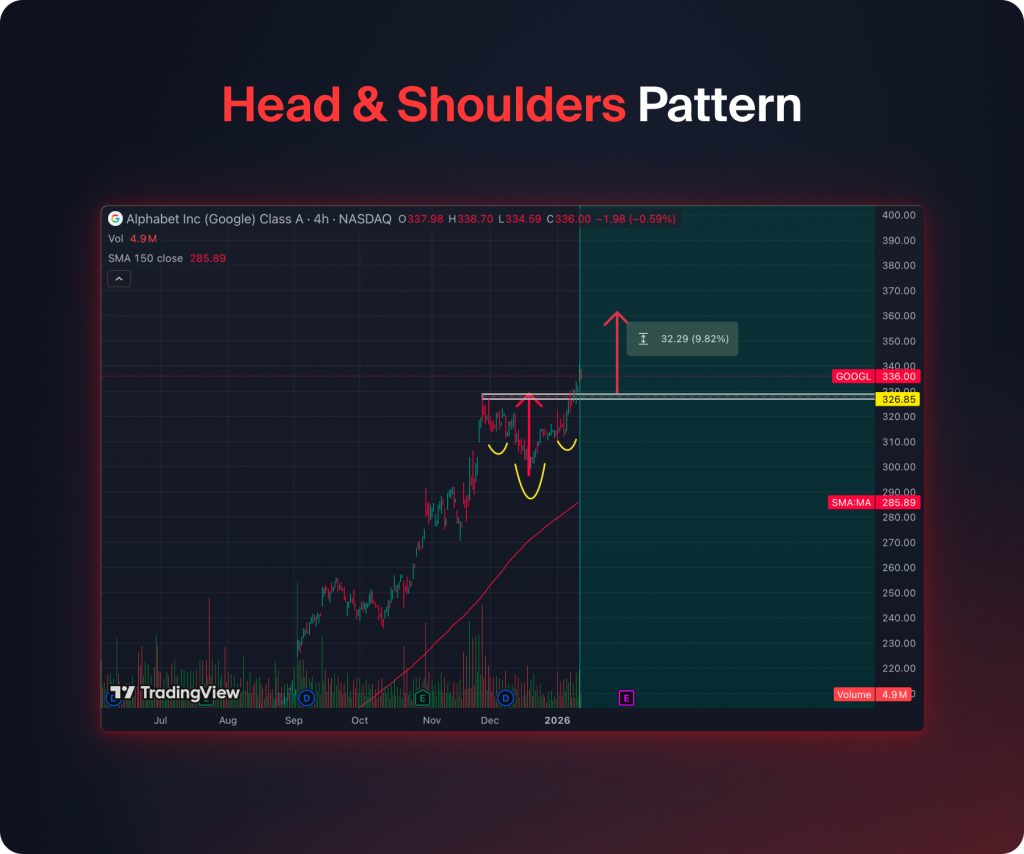
Como Negociar o Padrão Cabeça e Ombros
- Entrada: Vender a descoberto ou vender após uma quebra abaixo da linha do pescoço, ou seja, um fechamento de vela abaixo da linha do pescoço. Traders mais conservadores esperarão por um teste da linha do pescoço antes de entrar em uma operação.
- Stop Loss (SL): Seu nível de stop-loss deve estar acima do ombro direito. Este nível torna a reversão inválida se o preço ultrapassar esse ponto.
- Take Profit (TP): Para obter seu nível de take-profit, calcule a distância entre a cabeça e a linha do pescoço. Em seguida, estenda essa distância para baixo a partir do ponto onde a linha do pescoço quebra.
2. Padrão Inverso de Cabeça e Ombros
O padrão Inverse Head and Shoulders é um método muito confiável para uma reversão de alta no mercado. Este padrão geralmente ocorre no final de um longo período de tendências de baixa, marcando o enfraquecimento dos vendedores no mercado e o início de uma possível virada para cima. Este padrão de mercado representa uma mudança no sentimento do mercado, onde o controle sobre o mercado transita lentamente do vendedor para o comprador.
Como o Padrão Inverso de Cabeça e Ombros se Forma
O padrão contém quatro elementos principais:
- Ombro Esquerdo: Os preços caem e depois sobem para formar o primeiro vale. Isso indica intensa pressão para vender, seguida por um interesse de compra inicial.
- Cabeça: O preço cai abaixo do ombro esquerdo, formando um fundo mais profundo, e depois sobe novamente. Isso marca a exaustão final dos vendedores, onde os vendedores empurram o preço para um novo mínimo, mas não conseguem sustentá-lo.
- Ombro Direito: O preço cai novamente, mas não consegue atingir a mínima da cabeça. Isso sinaliza fraqueza entre os vendedores e crescente força dos compradores.
- Decote: Este nível de resistência marca a conexão entre os dois altos de rebound. Este decote representa o ponto crítico de confirmação, e romper acima dele significa que os compradores assumiram o controle.
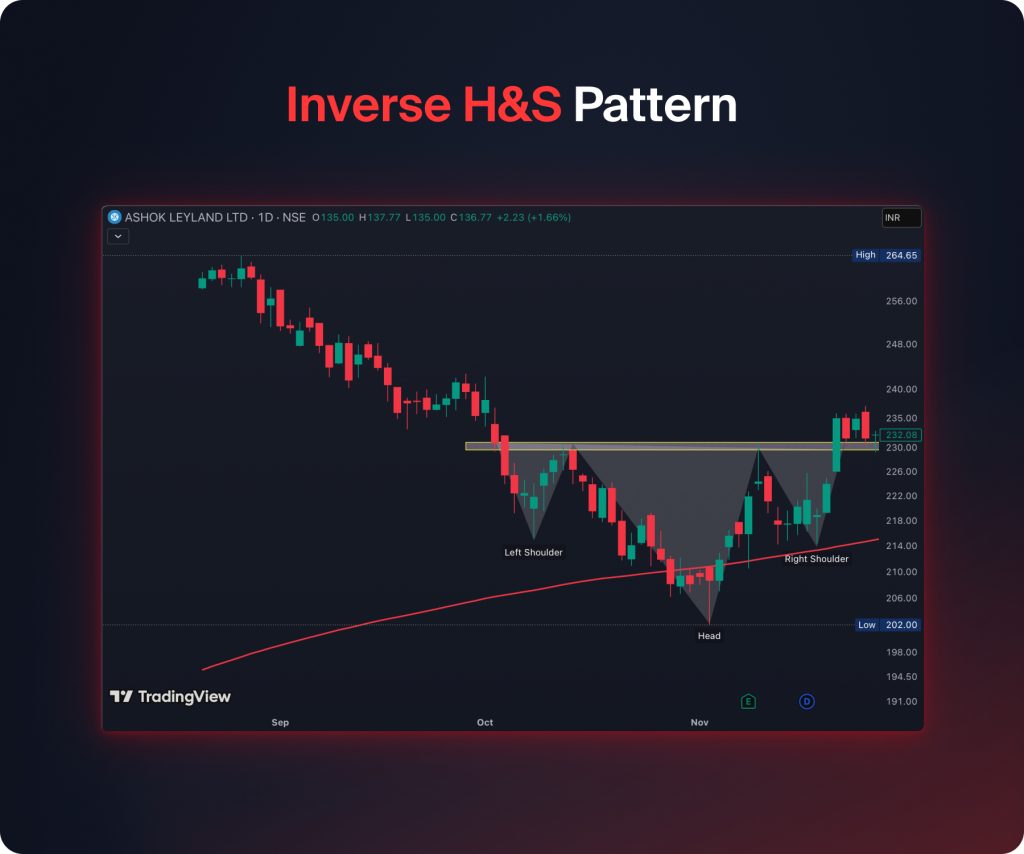
Como Negociar o Padrão de Cabeça e Ombros Invertido
- Entrada: Para ir comprado, deve haver uma quebra acima da linha do pescoço, o que significa um fechamento de vela acima da linha do pescoço. Traders mais cautelosos esperarão um reteste da linha do pescoço antes de fazer uma entrada.
- Stop-Loss: Posicione o stop loss abaixo do ombro direito. Este nível torna a reversão inválida caso o preço caia abaixo dele.
- Take Profit: Calcule o comprimento da cabeça até a linha do pescoço. Em seguida, estenda esse comprimento para cima a partir do ponto de rompimento da linha do pescoço.
3. Padrão de Duplo Topo
O padrão de Duplo Topo é um padrão de reversão de baixa estabelecido que ocorre após uma evidente tendência de alta. É um indicador de enfraquecimento da pressão de compra com a iniciação do controle pelos vendedores. Este padrão representa uma incapacidade da força de compra de empurrar o preço além de um nível significativo de resistência.
Como o Padrão de Duplo Topo Se Forma
O padrão de topo duplo contém três componentes principais:
- Primeiro Topo: O preço sobe vigorosamente e marca um pico, então começam as correções. Neste padrão, a força de compra do mercado é evidente, assim como o desenvolvimento da pressão de venda.
- Decote: O retrocesso forma um nível de suporte. Este nível de suporte torna-se importante para a confirmação do padrão.
- Segundo Topo: O preço sobe mais uma vez e para em torno do mesmo nível do primeiro topo, mas não consegue se mover acima. Isso marca a dominância da resistência.
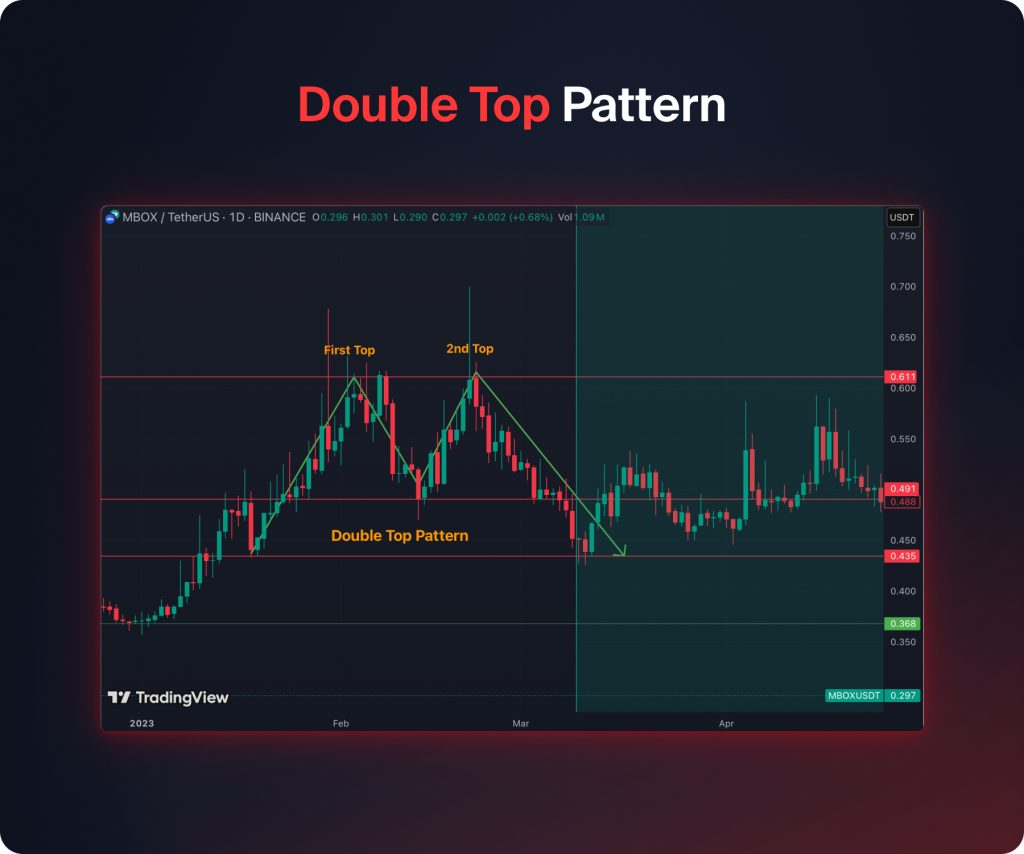
Como Negociar o Padrão de Duplo Topo
- Entrada: Entre em uma posição curta após uma quebra confirmada abaixo da linha do pescoço, significando um fechamento de vela abaixo da linha do pescoço. Se você é um trader conservador, pode esperar por um reteste da linha do pescoço antes de entrar.
- Stop Loss: Coloque o stop acima do segundo topo. Este nível invalida o padrão se o preço romper acima dele.
- Lucro Máximo: Meça a distância do topo até a linha do pescoço. Em seguida, projete essa distância para baixo a partir da quebra da linha do pescoço.
4. Fundo Duplo
O Fundo Duplo é um padrão de reversão tradicional que ocorre em uma tendência de baixa. O fundo duplo indica que a pressão de venda está diminuindo e os compradores estão assumindo o controle do mercado. O padrão de Fundo Duplo ocorre quando os vendedores não conseguem empurrar os preços abaixo de um nível específico de suporte, resultando em uma reversão para cima.
Como o Padrão de Fundo Duplo se Forma
Como um topo duplo, este padrão envolve três componentes principais:
- Primeiro Fundo: Os preços caem consideravelmente e fazem um fundo, depois se recuperam. Isso indica uma intensa pressão de venda e um subsequente interesse de compra.
- Decote: O rebote gera um nível de resistência que se torna crítico para a verificação do padrão.
- Segundo Fundo: Os preços caem e atingem níveis semelhantes ao primeiro fundo, sem cair mais. É um sinal de que os vendedores estão perdendo impulso e os compradores estão ganhando impulso.
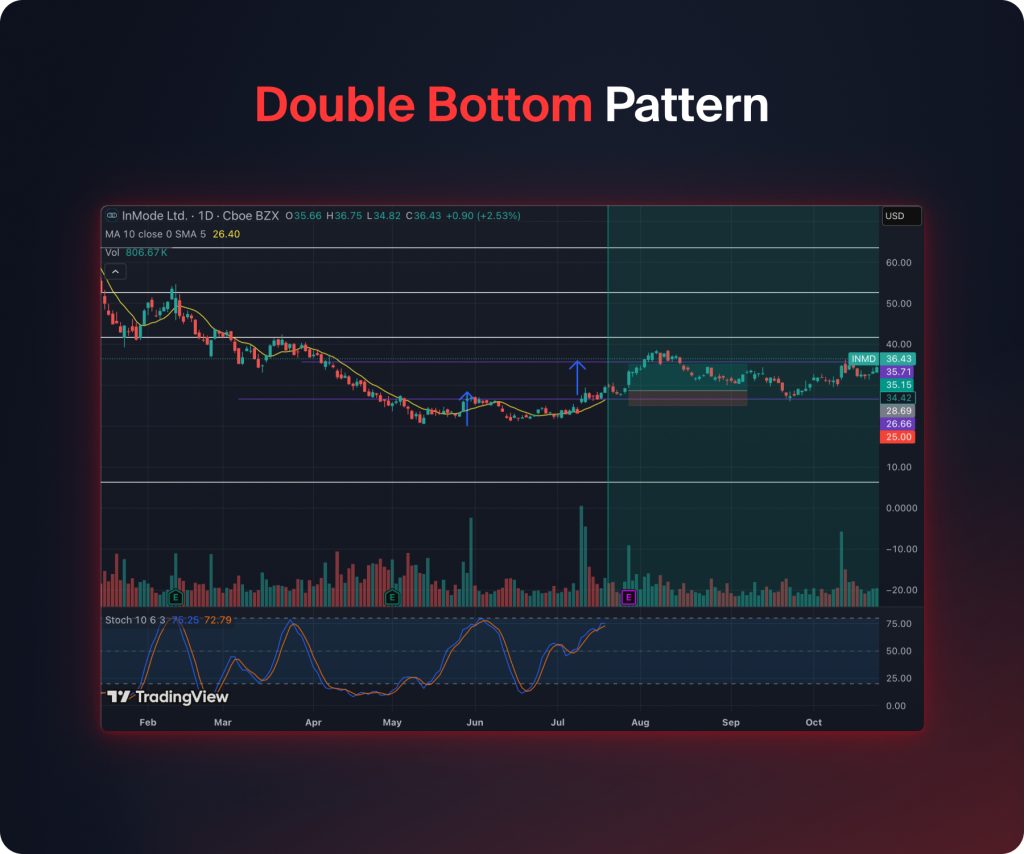
Como Negociar o Padrão de Duplo Fundo
- Entrar: Entre em uma posição comprada após uma quebra acima da linha de pescoço, indicando fechamento acima da linha de pescoço. Traders mais conservadores podem optar por entrar no reteste da linha de pescoço.
- Stop Loss: O stop pode ser colocado abaixo do segundo fundo. Este stop loss invalida o padrão se o preço romper este nível.
- Take Profit: Calcule a distância da base até a linha de pescoço. Mova essa distância para cima a partir do ponto de rompimento da linha de pescoço.
5. Padrão de Topo Triplo
Um padrão de topo triplo é um padrão de reversão de baixa confiável que ocorre após uma forte tendência de alta. Indica uma queda na força dos compradores, e os vendedores assumem o controle. Um padrão de topo triplo indica uma série de tentativas das forças compradoras de ultrapassar um nível específico de resistência, resultando, em última análise, em uma queda acentuada.
Como um Padrão de Triplo Topo se Forma
Este padrão tem quatro elementos principais:
- Primeiro Topo: Os preços sobem e depois atingem um pico, apenas para recuar, formando o primeiro topo. Isso indica uma atividade de compra vigorosa seguida por uma pressão de venda inicial.
- Segundo Topo: O preço novamente sobe para cerca do mesmo nível que o primeiro topo, mas não consegue ultrapassar isso. Isso indica uma fraqueza na força de compra.
- O Terceiro Topo: O preço faz outra tentativa de se recuperar ao mesmo nível de resistência, mas falha em romper, garantindo assim que o topo está exaurido.
- Decote: Os recuos de cada máxima formam um nível de suporte, que se mostra muito significativo. Quebrar abaixo do decote indica que os vendedores estão no controle.
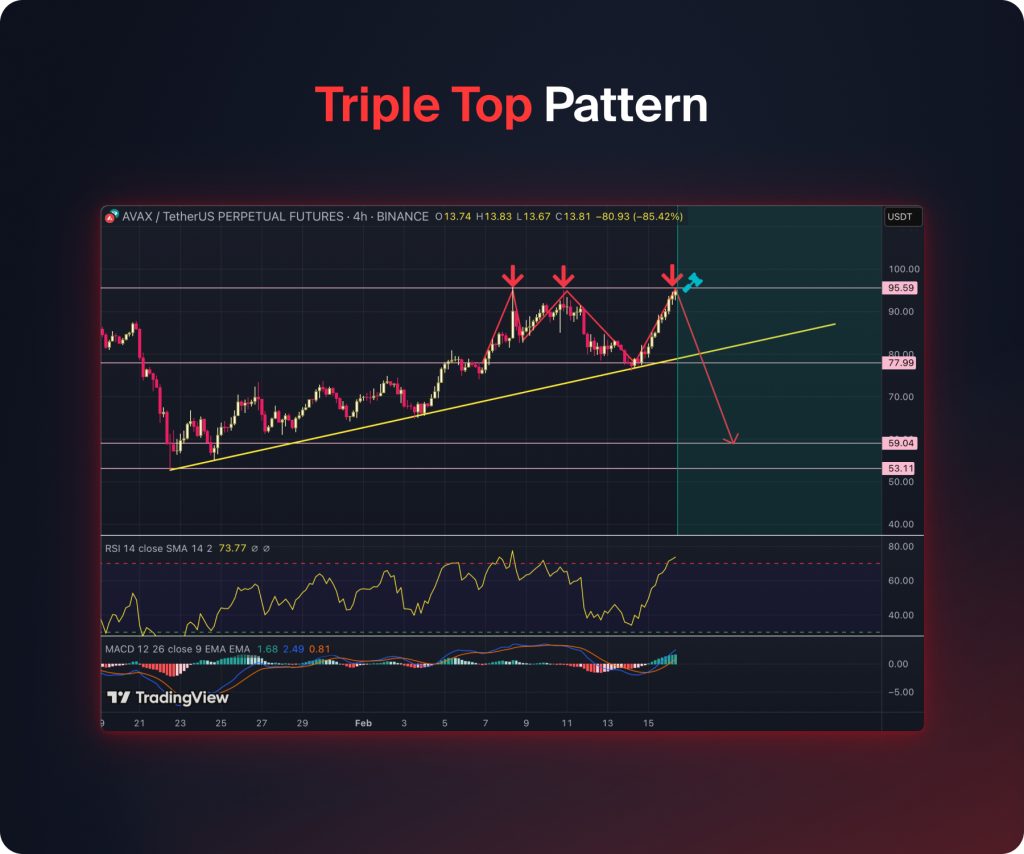
Como Negociar o Padrão de Triple Top
- Entrada: Após uma quebra abaixo da linha do pescoço, ou seja, quando há um fechamento abaixo da linha do pescoço. Traders mais cautelosos podem optar por entrar quando houver um reteste da linha do pescoço.
- Stop Loss: Coloque o stop acima do terceiro topo. Este nível tornará o padrão inválido se o preço subir acima dele.
- Take Profit: Calcule o comprimento dos pontos altos até a linha de pescoço. Em seguida, projete para baixo a partir da linha de pescoço.
6. Padrão Triplo de Fundo
O padrão de Triplo Fundo é um padrão de reversão de tendência de alta confiável, que geralmente ocorre após uma tendência de baixa prolongada. Indica uma desaceleração no momentum de vendas e o início do momentum de compras. Representa a falha consistente dos vendedores em permitir que o preço fique abaixo de um nível de suporte significativo, seguido por um movimento ascendente acentuado.
Como o Padrão Triplo de Fundo se Forma
Quatro componentes compõem o padrão:
- Primeiro Fundo: O preço desce até um certo nível e então reverte. O primeiro fundo mostra que há uma intensa pressão de venda, mas o interesse de compra está presente.
- Segundo Fundo: O preço cai novamente para cerca do mesmo nível que o primeiro fundo, mas não quebra para baixo; isso indica exaustão dos vendedores.
- Terceiro Fundo: O preço tenta cair para o mesmo nível novamente, mas não consegue ultrapassá-lo, confirmando um aumento no poder de compra.
- Decote: Os rebounds das mínimas estabelecem um nível de resistência que se torna crítico. Quebrar acima desse nível demonstra que os compradores estão no controle.
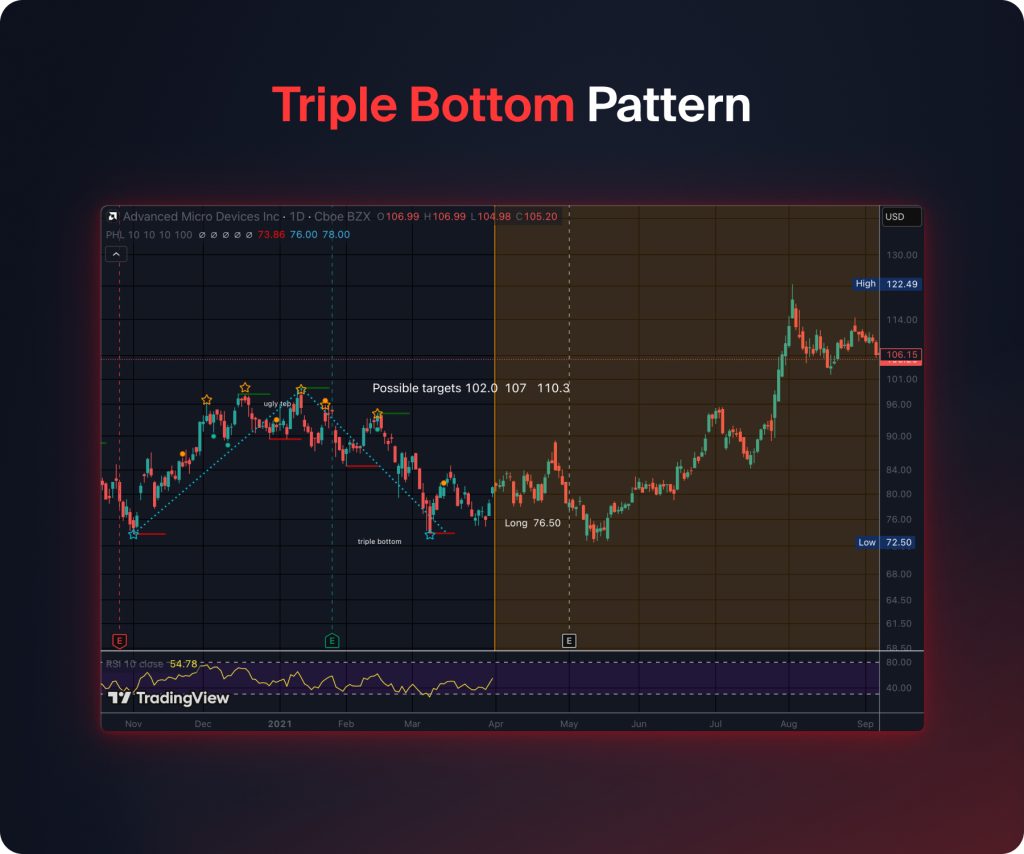
Como Negociar o Padrão de Triplo Fundo
- Entrada: Assuma uma posição comprada após uma quebra confirmada acima da linha de pescoço, com um fechamento de vela acima dela. Você pode, no entanto, esperar por um teste da linha de pescoço para confirmar essa entrada.
- Stop Loss: Posicione o stop abaixo do terceiro fundo. Este nível de stop loss torna o padrão inválido se o preço cair abaixo dele.
- Take Profit: Calcule a distância do fundo até a linha do pescoço. Em seguida, projete essa distância para cima a partir da linha do pescoço.
7. Padrão de Topo Arredondado
O Padrão de Topo Arredondado é um padrão de reversão que é considerado baixista. Ele tende a ocorrer após uma tendência de alta prolongada. Geralmente indica um momentum de compra em declínio e que os vendedores estão lentamente assumindo o controle. Este padrão é uma transição na psicologia do mercado de altista para baixista.
Como se Forma o Padrão de Topo Arredondado
Este padrão tem quatro elementos principais:
- Lado Esquerdo do Topo: O preço aumenta de forma constante, mas desacelera, refletindo que os compradores estão perdendo impulso.
- Pico (Topo): O preço atinge um topo arredondado, completando o pico do padrão. Neste estágio, os compradores que tentam elevar os preços enfrentam dificuldades, enquanto a pressão de venda começa.
- Lado Direito do Topo: O preço começa a cair continuamente, semelhante ao lado esquerdo. Isso significa que os vendedores estão no controle.
- Nível de Suporte/Decote: O nível de suporte é criado na parte inferior do padrão. Uma quebra abaixo desse nível confirma a reversão de baixa.

Como Negociar o Padrão de Topo Arredondado
- Entrada: Entre em uma posição vendida assim que houver uma quebra confirmada abaixo do nível de suporte (linha do pescoço), com um fechamento de vela. Você pode esperar por um teste de reteste da linha do pescoço antes de fazer uma entrada.
- Stop Loss: Posicione o stop acima do pico do topo arredondado. Isso invalida o padrão se o preço cruzar para cima.
- Take Profit: Calcule a distância do pico até o ponto de suporte e estenda-a para baixo a partir do ponto de rompimento da linha do pescoço.
8. Padrão de Fundo Arredondado
A formação de fundo arredondado é outro padrão de reversão de alta que geralmente aparece após um prolongado movimento de baixa. É uma indicação de um enfraquecimento do momento de venda e de um interesse crescente de compra.
Como o Padrão de Fundo Arredondado se Forma
A estrutura tem quatro elementos principais:
- Lado Esquerdo da Parte Inferior: Os preços começam a cair, mas desaceleram, mostrando um momentum de venda em declínio.
- Fundo (Base): O preço cai em um fundo arredondado, criando a fundação. Os vendedores não conseguem forçar o preço para baixo, e os compradores entram no mercado.
- Lado Direito da Parte Inferior: Os preços sobem lentamente em linha com o lado esquerdo. Isso indica que os compradores estão ganhando controle.
- Linhas de Pescoço/Nível de Resistência: O nível de resistência está localizado no topo do padrão. Romper esse nível de resistência confirma uma reversão de alta.
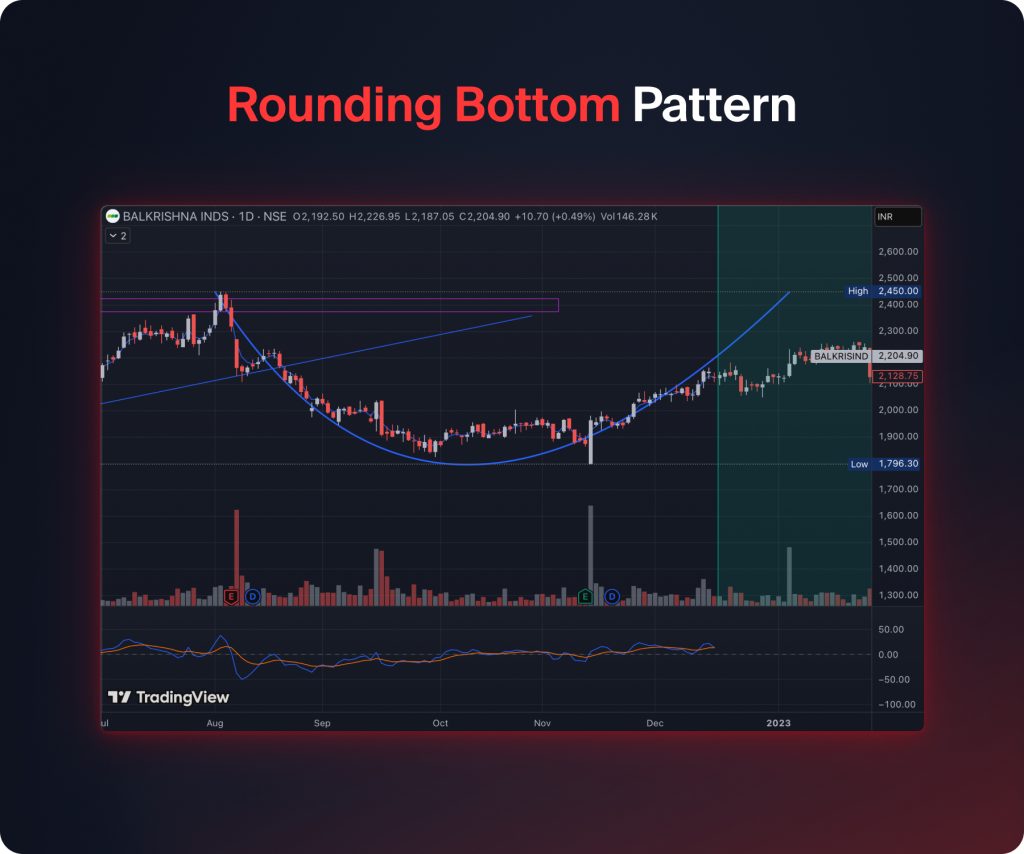
Negociando o Padrão de Fundo Arredondado
- Entrada: Você deve entrar em uma posição comprada após a quebra do nível de resistência (linha de pescoço), ou seja, após um candle fechar acima dele. Você também pode esperar e entrar após o reteste do nível de resistência.
- Stop Loss: O stop loss deve ser colocado abaixo do fundo no padrão de fundo arredondado. Isso invalida o padrão caso o preço caia abaixo dele.
- Take Profit: Calcule a distância do fundo até o nível de resistência. Em seguida, estenda essa distância para cima a partir da quebra da linha do pescoço.
9. Padrão de Reversão da Ilha
O padrão de reversão da ilha é um padrão de reversão de tendência forte que pode se desenvolver no pico de uma tendência de alta ou no fundo de uma tendência de baixa. Indica uma mudança forte no sentimento do mercado, que geralmente ocorre quando um gap isola um cluster de ação de preço (“a ilha”), e então a tendência reverte repentinamente.
Como o Padrão de Reversão da Ilha se Forma
Este padrão tem quatro partes principais:
- Leading Gap: Lacunas de preço na direção da tendência existente, criando separação da ação de preço anterior. Isso mostra um forte momento de continuação antes da reversão.
- Formação de Ilha: Um grupo de ação de preço se forma isolado da atividade de negociação anterior, criando a “ilha.” Esta área representa a exaustão da tendência atual.
- Gap de Trajeto: Lacunas de preço contrárias à tendência inicial, solidificando a reversão. Esse tipo de lacuna representa uma transição abrupta de poder de compradores para vendedores no caso de um topo ou de vendedores para compradores no caso de um fundo.
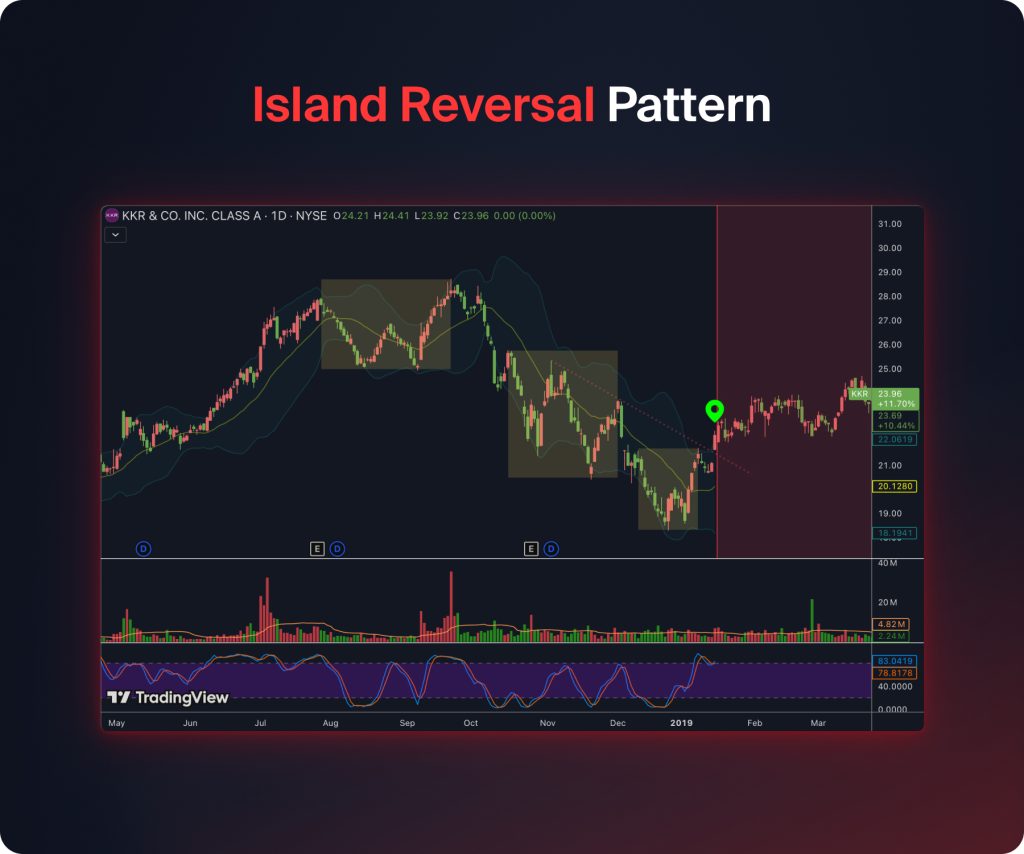
O fechamento da lacuna mostra que a tendência se inverteu porque a ilha isolada está ficando para trás.
Como Negociar o Padrão de Reversão da Ilha
- Entrada: Entre em uma negociação na direção da reversão, após o gap de acompanhamento ter fechado, para confirmar o padrão de reversão. Traders conservadores podem esperar por um reteste da área do gap.
- Stop Loss: Coloque o stop acima do gap de liderança para uma reversão de baixa ou abaixo do gap de liderança para uma reversão de alta. Esse nível se torna inválido se o preço reverter de volta para a ilha.
- Take Profit: Meça a altura da ilha desde o início da lacuna até o final do cluster e projete-a na direção da reversão.
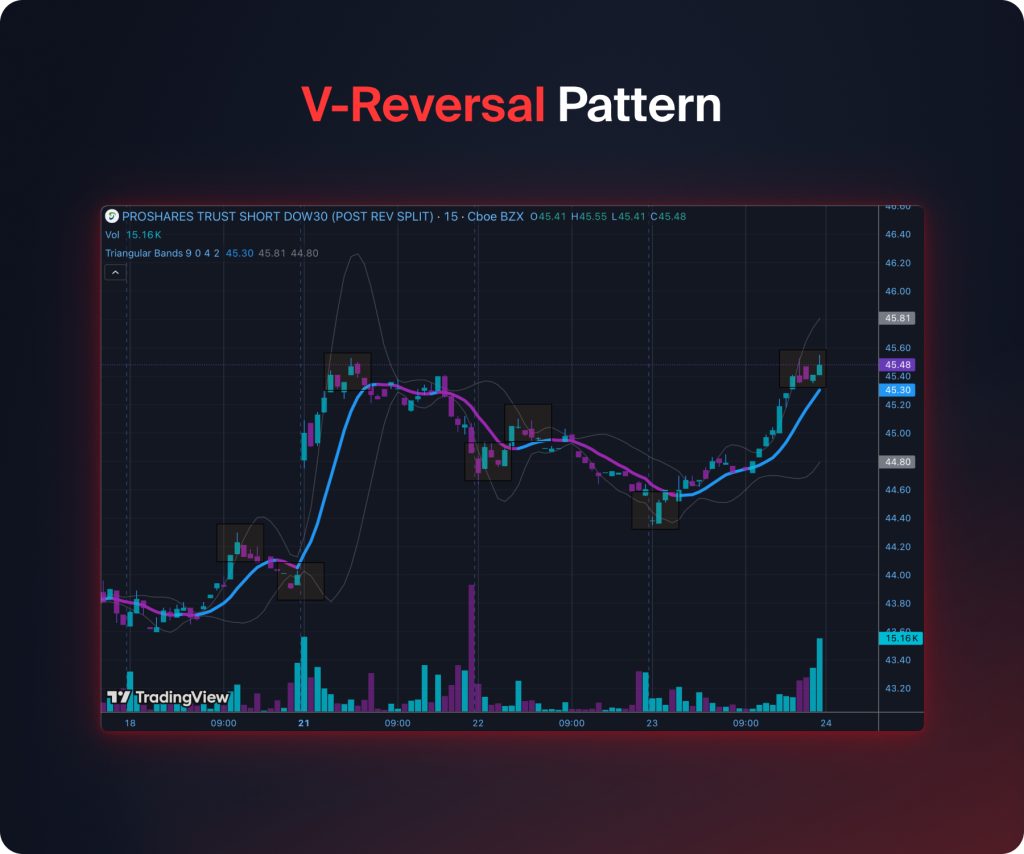
10. Padrão V-Reversal
O padrão V-Reversal representa um padrão de reversão decisivo e definitivo que ocorre após a conclusão de uma forte tendência de alta ou baixa. Este padrão indica uma mudança repentina no movimento do mercado como resultado de um lado sendo superado pelo outro devido a compras ou vendas em pânico.
Como o Padrão de V-Reversal se Forma
O padrão consiste em quatro componentes principais:
- Movimento de Tendência Acentuada: Este movimento vê uma rápida mudança de direção de preço, seja para cima ou para baixo, devido ao aumento do momentum nas tendências.
- Ponto de Exaustão: O momentum começará a desacelerar quando compradores ou vendedores alcançarem níveis extremos, mostrando assim que a tendência está perdendo força.
- Reversão Afiada: Uma reversão imediata do preço, formando a forma da letra “V.” Isso indica uma mudança rápida na dominância do mercado de vendedor para comprador (para um padrão de fundo) ou de comprador para vendedor (para um padrão de topo).
- Confirmação: O preço continua a se mover na nova direção, confirmando a reversão. Normalmente, é quando o volume aumenta, enfatizando a mudança no poder de mercado.
Como Negociar o Padrão de Reversão em V
- Entrada: Entre na negociação na direção da reversão uma vez que ela seja confirmada, geralmente após um fechamento além do ponto de exaustão. Traders conservadores podem optar por esperar uma confirmação adicional, como um reteste.
- Stop Loss: O stop loss está além do extremo da tendência inicial. Ele será violado se o preço continuar se movendo na tendência inicial.
- Take Profit: A distância da extremidade da primeira tendência até o ponto de reversão é medida e projetada na nova direção.
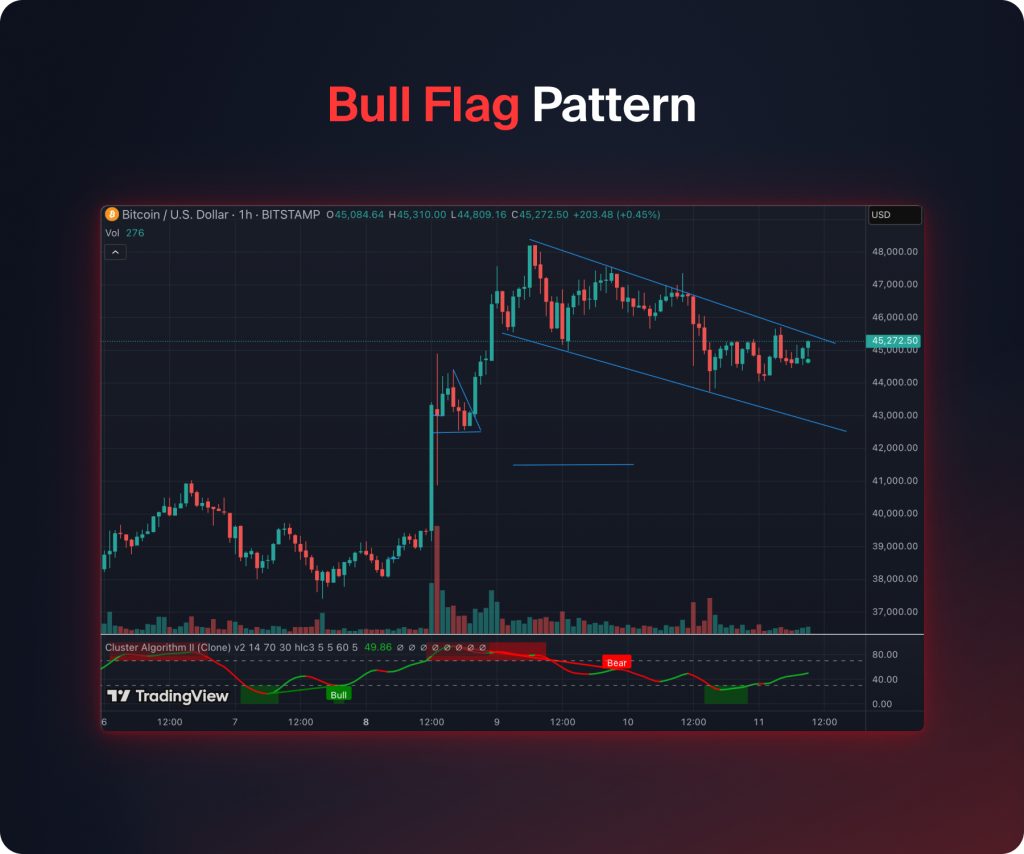
11. Padrão Bull Flag
O padrão de bandeira de alta é um tipo de padrão de continuação altista que ocorre durante uma tendência de alta. O padrão indica uma breve pausa na tendência, mas com uma continuação ascendente em seguida. Ele mostra onde os compradores momentaneamente realizam lucros.
Como o Padrão de Bandeira de Touro se Forma
- Flagpole: Representa um forte avanço, formando o momento inicial.
- Bandeira: O preço está se consolidando através de um canal estreito e em declínio, indicando uma correção ou realização de lucros.
- Ruptura: O preço ultrapassa o limite superior da formação de bandeira, marcando a continuação da tendência de alta.
Como Negociar o Padrão de Bandeira de Touro
- Entrada: Entre em uma posição longa após o preço cruzar o limite superior da formação da bandeira, preferencialmente em volume alto.
- Stop Loss: Posicione o stop abaixo da borda inferior da bandeira.
- Take Profit: A altura de um mastro de bandeira precisa ser medida e, em seguida, projetada a partir do ponto de rompimento.
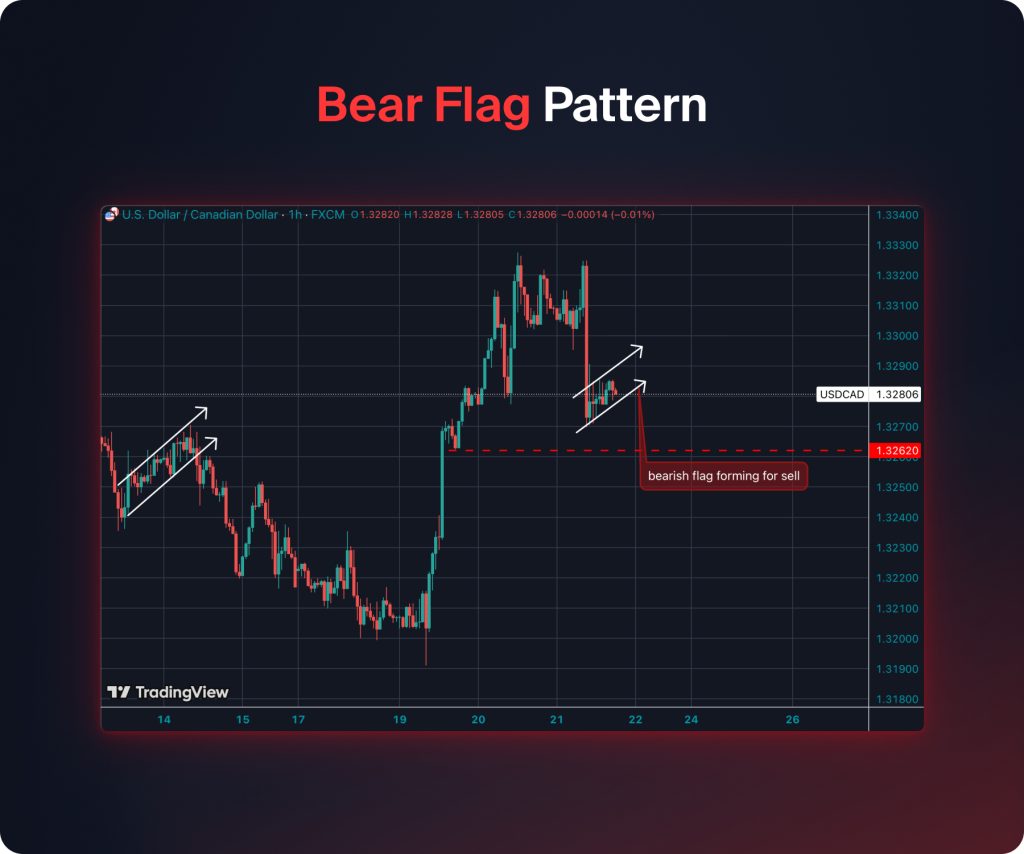
12. Padrão de Bandeira de Urso
É um padrão de continuação de baixa feito durante uma tendência de queda. Representa uma pausa na tendência para retomar a tendência de baixa. Representa o suporte temporário da tendência pelos compradores, e depois, os vendedores assumem o controle.
Como o Padrão da Bandeira do Urso se Forma
- Flagpole: O movimento acentuado para baixo representa o momento inicial.
- Flag: O preço se consolida dentro de um canal estreito em inclinação ascendente.
- Quebra: O preço cai abaixo do limite inferior da bandeira, indicando a continuação da tendência de baixa.
Como Negociar o Padrão da Bandeira de Urso
- Entrada: Abra uma posição vendida se o preço cair abaixo do limite inferior da bandeira, de preferência em altos volumes.
- Stop Loss: Coloque o stop acima do limite superior da bandeira.
- Take Profit: Calcule a altura do mastro e estenda-o para baixo a partir do ponto de ruptura.
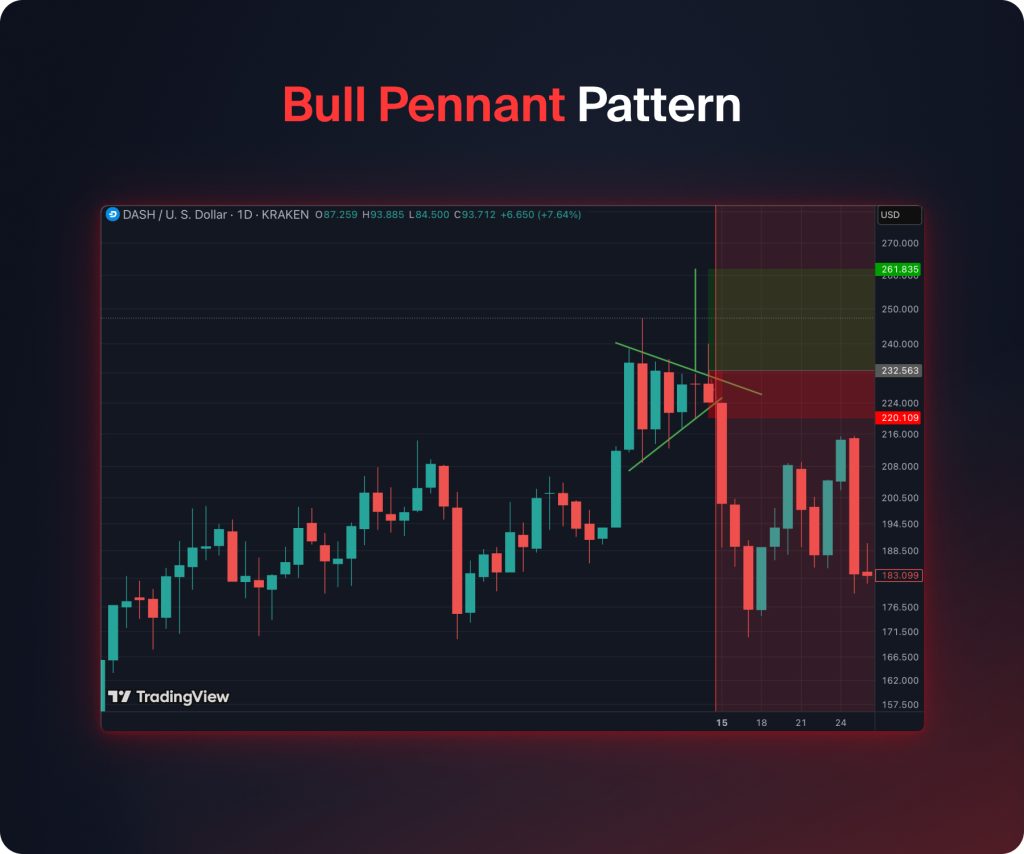
13. Padrão de Bandeira de Alta
Um pavilhão de touro é um padrão de continuação altista que ocorre quando os mercados estão passando por uma forte tendência de alta. Esse padrão destaca um curto período que sinaliza uma breve pausa antes de continuar o movimento altista geral.
Como o Padrão de Bandeira de Touro se Forma
- Flagpole: Um forte movimento ascendente constitui o momento inicial.
- Pennant: O preço forma um pequeno triângulo simétrico, indicando que o momento de compra diminuiu momentaneamente.
- Breakout: Há um movimento de preço acima da borda superior da bandeira, indicando a continuação da tendência de alta.
Como Negociar o Padrão de Bandeira Bullish
- Entrada: Depois que o preço ultrapassar o limite superior da formação do estandarte, entre em uma posição longa em volumes mais altos.
- Stop Loss: Posicione o stop loss abaixo da limite inferior do estandarte.
- Take Profit: Meça a altura do mastro e estenda essa altura acima do ponto de rompimento.
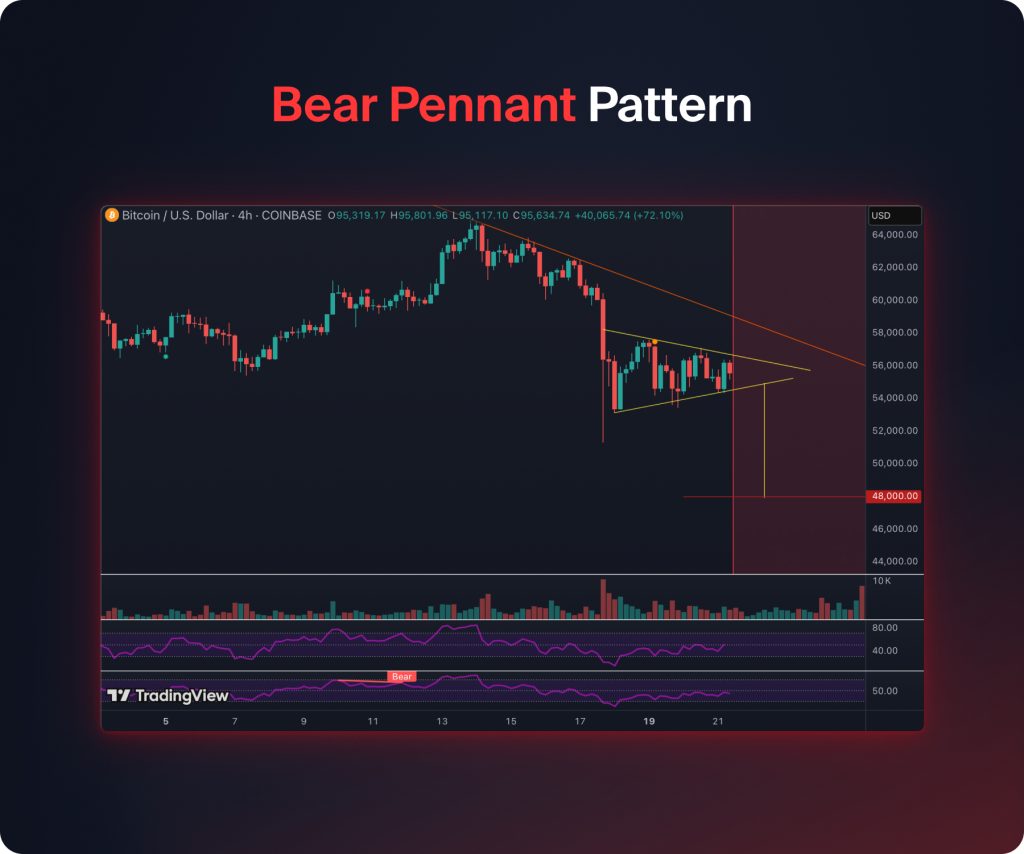
14. Padrão de bandeira de baixa
Este é um padrão de continuação de baixa que aparece em uma forte tendência de queda, indicando uma pausa de curto prazo antes de continuar a tendência de baixa.
Como o Padrão de Bandeira do Urso se Forma
- Flagpole: O forte movimento para baixo fornece o impulso inicial.
- Pennant: O preço está se consolidando em um pequeno triângulo simétrico, levemente para cima ou lateralmente.
- Quebra: O preço quebrou abaixo da fronteira inferior do pavilhão, indicando que a tendência de queda continuou.
Como Negociar o Padrão de Bandeira de Urso
- Entrada: Vá vendido após romper abaixo da borda inferior da bandeira, de preferência com maior volume.
- Stop Loss: O stop deve ser colocado acima do limite superior do pavilhão.
- Take Profit: Calcule a altura do mastro da bandeira e estenda-a para baixo a partir do ponto de ruptura.
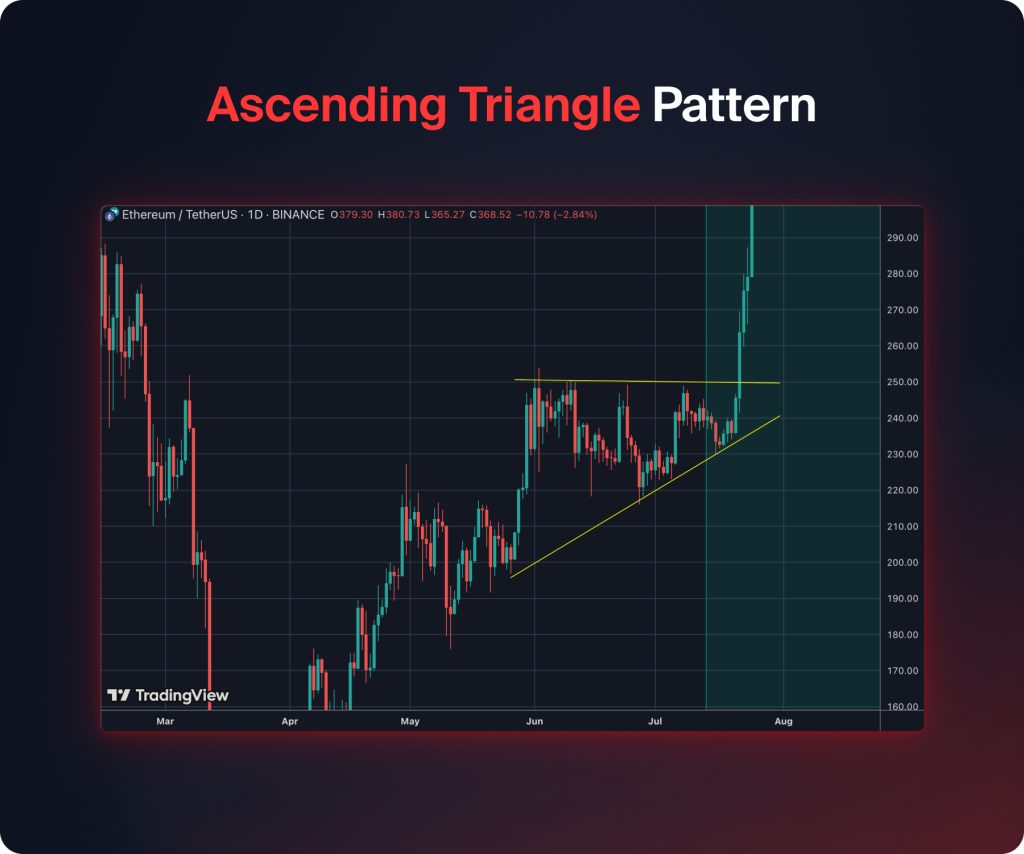
15. Padrão de Triângulo Ascendente
Um triângulo ascendente basicamente marca um padrão de continuação altista que surge dentro do quadro de uma tendência de mercado em alta. Tal Triângulo Ascendente sinaliza que o momento de compra está aumentando enquanto o dos vendedores está diminuindo. Esta é uma fase de acumulação que precede a continuação.
Como o Padrão do Triângulo Ascendente se Forma
- Resistência Fixa: O preço testa um nível de resistência fixa, mas não consegue superá-lo a princípio.
- Suporte Ascendente: Cada recuo faz um fundo mais alto, o que indica suporte ascendente.
- Romper: O preço eventualmente ultrapassa o nível de resistência, indicando que a tendência continuará.
Como Negociar o Padrão de Triângulo Ascendente
- Entrada: Vá longo em uma quebra confirmada acima do nível de resistência plana com alto volume.
- Stop Loss: Posicione o stop abaixo da linha de tendência de suporte que está subindo.
- Take Profit: Calcule a altura do triângulo e estenda-o para cima a partir do ponto de rompimento.
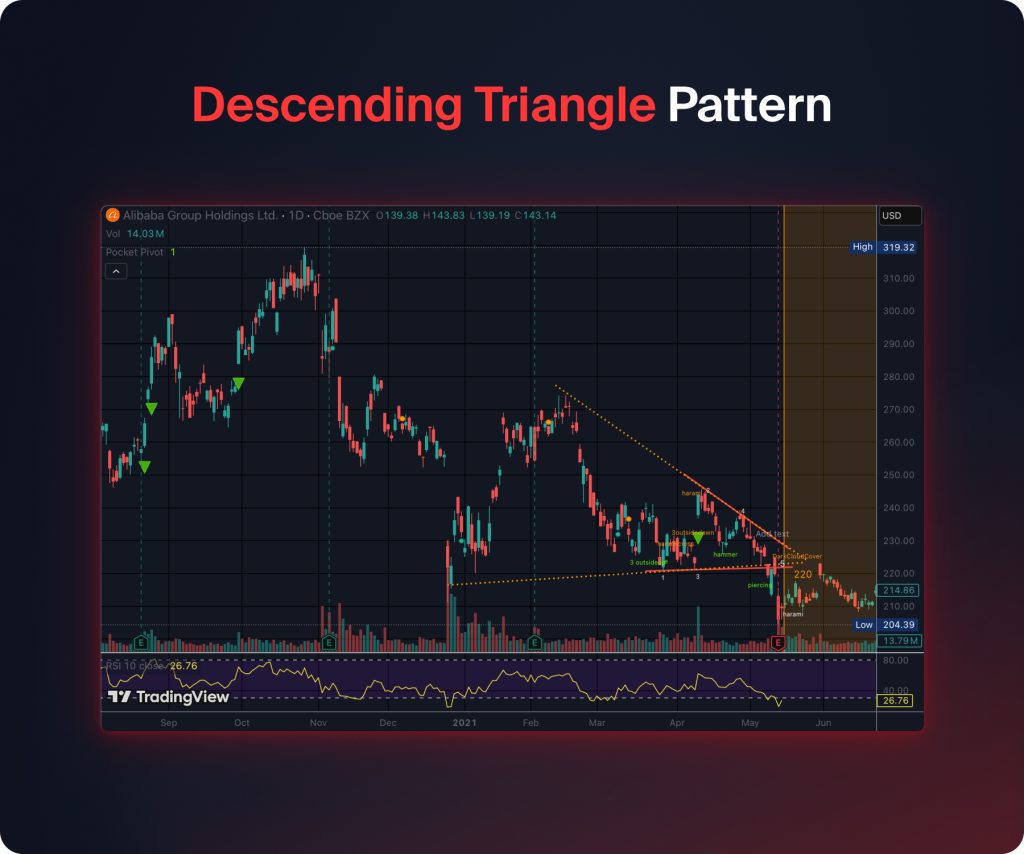
16. Padrão de Triângulo Descendente
Um triângulo descendente é um tipo de padrão de continuação de baixa e geralmente ocorre em uma tendência de mercado de baixa. Indica o aumento do poder dos vendedores e o enfraquecimento dos compradores.
Como o Padrão do Triângulo Descendente se Forma
- Suporte Plano: O preço toca repetidamente um nível plano de suporte, mas não consegue sustentá-lo.
- Resistência em Queda: Cada alta faz um pico mais baixo, uma indicação de crescente pressão de venda.
- Queda: O preço cai abaixo do nível de suporte, validando assim a continuação da tendência de baixa.
Como negociar o padrão de triângulo descendente
- Entrada: Vá short após uma quebra confirmada abaixo do nível de suporte plano, preferencialmente com volume alto.
- Stop Loss: Posicione o Stop acima da linha de resistência em queda.
- Take Profit: É a altura vertical do triângulo projetado para baixo a partir do ponto de quebra.
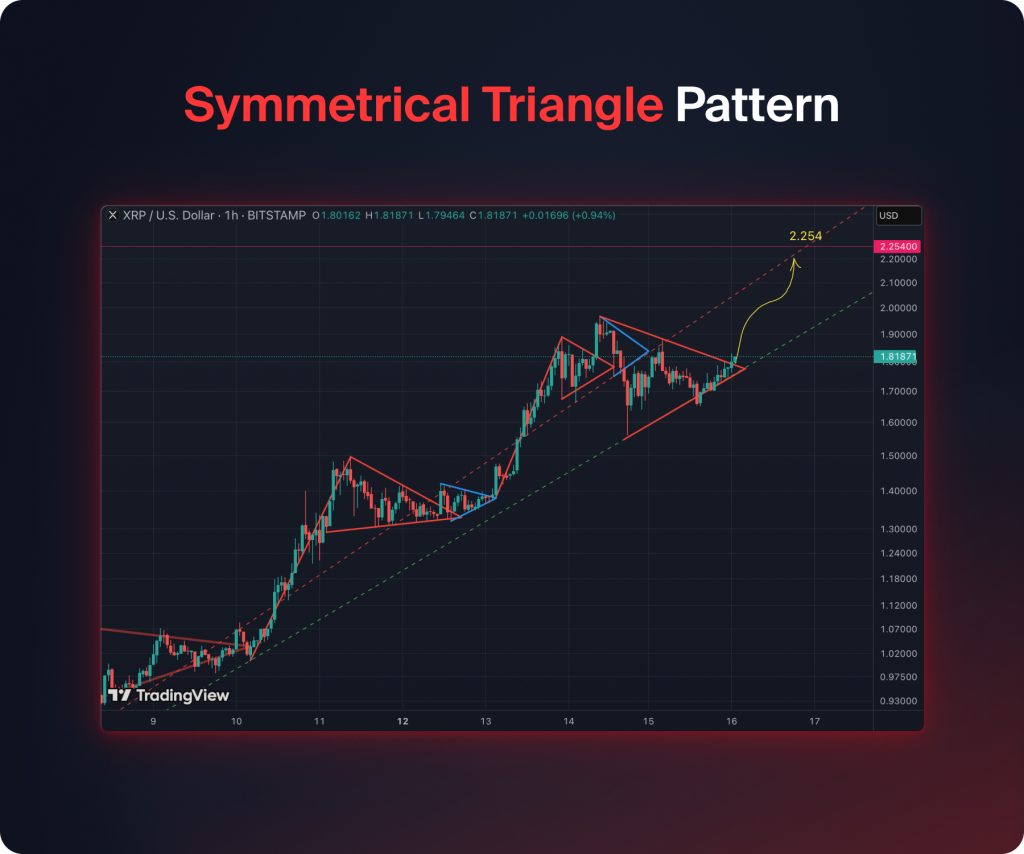
17. Padrão de Triângulo Simétrico
Um triângulo simétrico é um tipo de padrão de continuação que pode ser encontrado em uma tendência de alta ou uma tendência de baixa. Ele aponta para uma fase de equilíbrio entre as forças de compra e venda antes da retomada da tendência inicial. Um Triângulo Simétrico incorpora indecisão no mercado, que pode eventualmente se voltar a favor da tendência dominante.
Como o Padrão de Triângulo Simétrico se Forma
- Linhagens de Tendência Convergentes: O preço forma uma série de máximas mais baixas e mínimas mais altas, criando duas linhagens de tendência convergentes.
- Consolidação: O volume de negócios geralmente diminui à medida que o triângulo avança, indicando uma redução na volatilidade.
- Breakout / Breakdown: O preço eventualmente rompe na direção da tendência anterior, confirmando a continuação.
Como Negociar o Padrão de Triângulo Simétrico
- Entrada: Faça uma entrada de negociação na direção do rompimento após o fechamento, além da linha de tendência do triângulo. Traders conservadores podem esperar por um novo teste do rompimento.
- Stop Loss: Posicione o stop logo além do outro lado do triângulo.
- Take Profit: Meça a altura vertical do triângulo e projete essa altura a partir do ponto de rompimento.
18. Padrão de Retângulo (Continuação de Faixa)
O padrão de retângulo é um padrão de continuação de tendência em que o mercado faz um movimento plano entre as linhas de suporte e resistência, que são horizontais por natureza. É uma fase em que há um equilíbrio entre as forças de compra e venda no mercado.
Como o Padrão do Retângulo se Forma
- Suporte Horizontal: O preço mostra suporte de compra recorrente em um determinado nível de suporte.
- Resistência Horizontal: O preço enfrenta pressão de venda em um nível de resistência.
- Alta/Queda: O preço irá romper ou cair do retângulo na direção de negociação indicada pela tendência anterior.
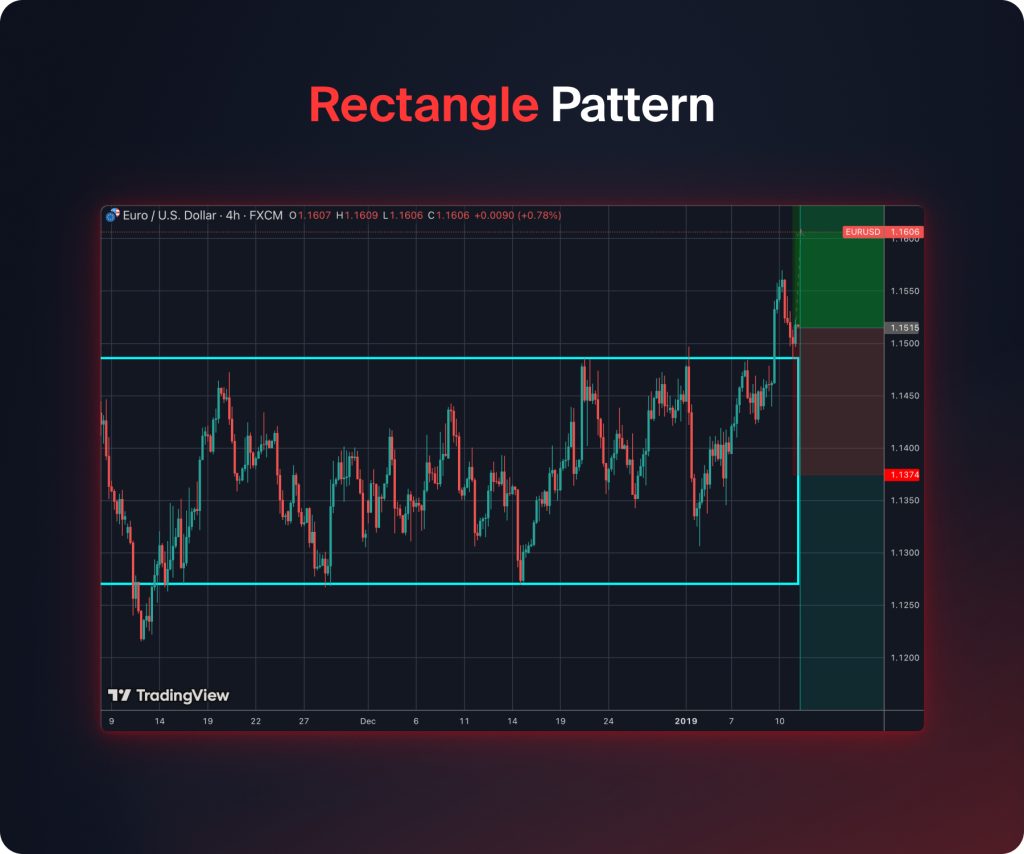
Como Negociar o Padrão Retângulo
- Entrada: Longo depois que o preço se move acima da resistência (para um sinal de compra) ou abaixo do suporte (para um sinal de venda) com um aumento no volume.
- Stop Loss: O stop-loss será definido dentro do retângulo, abaixo do suporte se vendendo ou acima da resistência se comprando.
- Lucro Realizado: Meça a altura do retângulo e estenda essa altura na direção da ruptura ou quebra.
19. Canal Ascendente
Este é um padrão de reversão de alta onde o preço sobe entre duas linhas paralelas. Isso indica que o preço está se movendo em uma tendência com níveis de suporte e resistência fortes, com uma demanda constante e correções ocasionais na tendência.
Como o Padrão de Canal Ascendente se Forma
- Linha de Tendência Inferior (Suporte): O preço encontra interesse regular de compra em uma linha de suporte com inclinação ascendente.
- Linha de Tendência Superior (Resistência): A ação enfrenta pressão de venda contra a linha de resistência paralela.
- Movimento do Canal: O movimento de preço entre suporte e resistência define o canal.
- Breakout: Um rompimento acima da linha de tendência superior confirmará a aceleração da tendência de alta. No entanto, uma quebra da linha de suporte faz o preço cair.
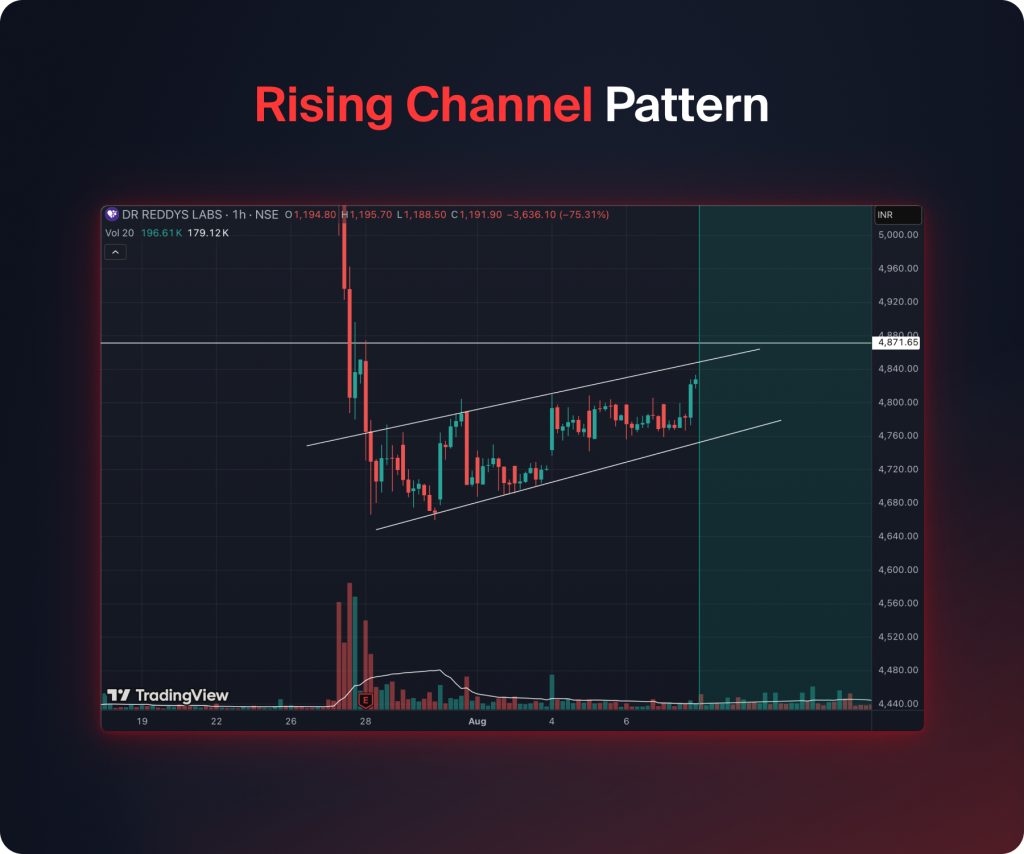
Como Negociar o Padrão de Canal Ascendente
- Regras de Entrada: Entre comprado após uma quebra acima da linha de tendência superior ou entre próximo à linha de tendência de suporte no canal. Se o preço quebrar a linha de suporte, aguarde um reteste para entrar em uma venda.
- Stop Loss: Posicione o stop logo abaixo (para uma compra) ou acima (para uma venda) da linha de tendência de suporte.
- Take Profit: Meça a largura do canal e estenda além do ponto de rompimento ou queda.
20. Canal de Queda
Este é um padrão de continuação de baixa que se forma quando os preços caem entre duas linhas de tendência paralelas. Ele sinaliza um mercado em baixa, no qual os vendedores estão no controle, embora com recuos periódicos.
Como o Padrão de Canal de Queda se Forma
- Linha de Tendência Superior (Resistência): O preço enfrenta consistentemente pressão de venda ao longo de uma linha de resistência inclinada para baixo.
- Linha de Tendência Inferior (Suporte): Os preços exibem suporte temporário de compra próximo a uma linha de suporte paralela.
- Movimento do Canal: O preço oscila entre Resistência e Suporte, criando a forma do canal descendente.
- Quebra: Uma queda abaixo da linha de tendência inferior confirma a tendência de baixa. No entanto, uma ruptura da linha de tendência superior sinaliza a reversão da tendência.
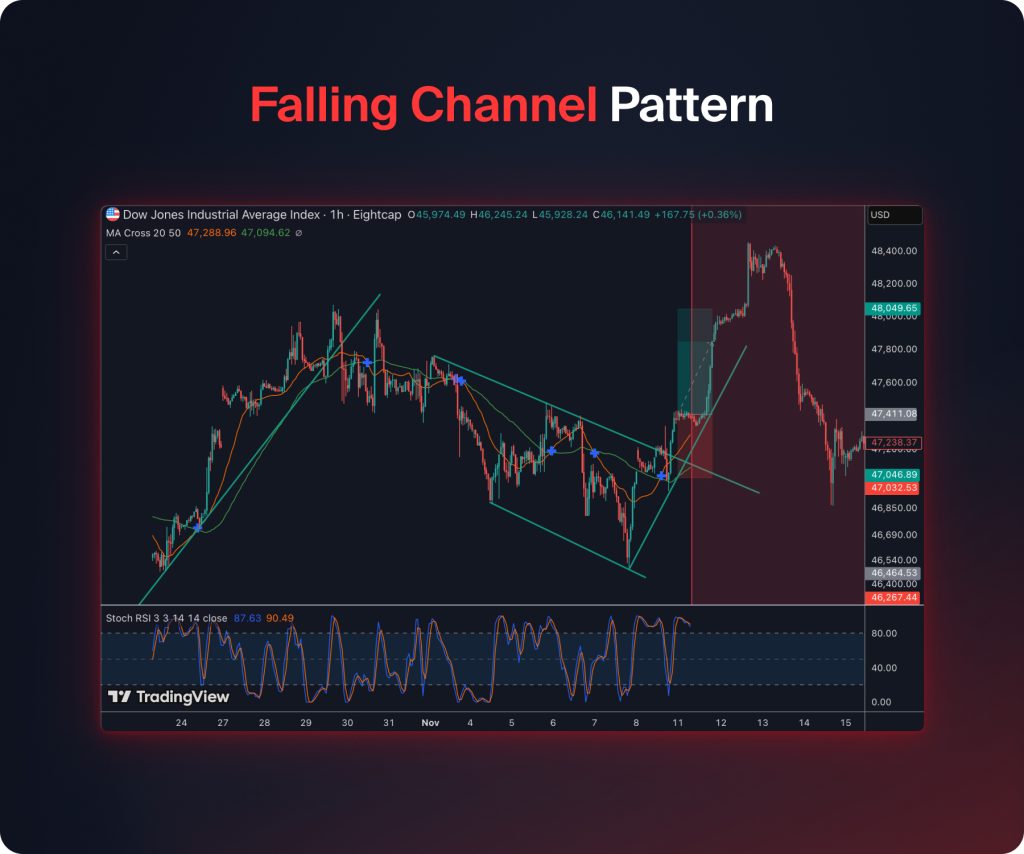
Como Negociar o Padrão de Gráfico do Canal de Queda
- Entrada: Vá vendido após uma quebra confirmada abaixo da linha de tendência inferior, ou venda perto da linha de resistência dentro do canal. Alternativamente, se a linha de resistência for quebrada, vá comprado, preferencialmente após um reteste.
- Stop Loss: Posicione o stop logo acima da resistência da linha de tendência superior (para uma venda) ou abaixo dela (para uma compra).
- Take Profit: Meça a largura do canal e estenda-a além do ponto de rompimento ou quebra.
21. Padrão Copo e Alça
Este é um padrão de continuação altista que indica uma pausa em uma tendência de alta antes de retomar depois. Representa uma fase de consolidação e realização de lucros.
Como o Padrão Copo e Alça se Forma
- Cop cup: O preço forma um fundo arredondado que se assemelha a um formato de ‘U’, o que indica uma consolidação gradual após uma tendência de alta.
- Handle: Os pequenos recuos/movimentos laterais aparecem do lado direito da xícara, mostrando uma leve pressão de venda.
- Breakout: O preço se move acima da resistência criada pela borda da xícara, marcando a continuação da tendência de alta. No entanto, o breakout deve fechar com um corpo de candle.
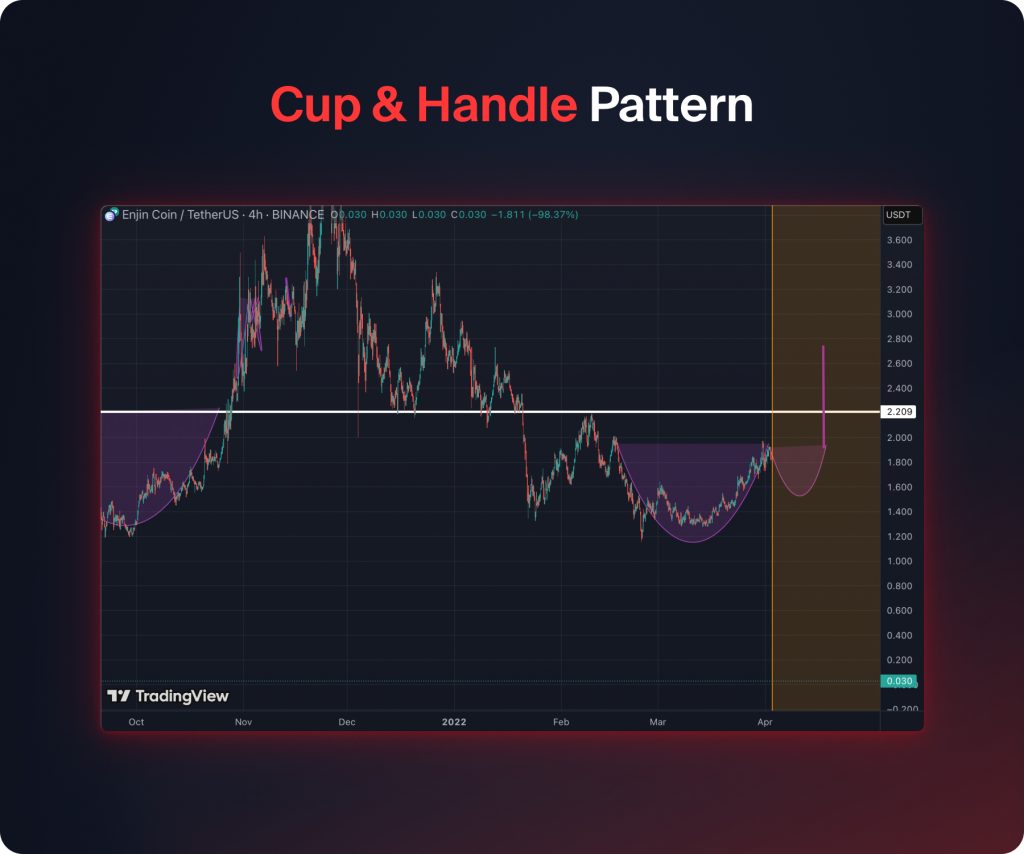
Como Negociar o Padrão de Copo e Alça
- Entrada: Vá longo após uma ruptura acima da resistência na alça, preferencialmente em volumes mais altos. Você também pode esperar por um reteste.
- Stop Loss: Posicione o stop abaixo do mínimo da alça.
- Levar Lucro: Meça a profundidade da taça e estenda-a para cima a partir do ponto de rompimento.
22. Padrão de Copo e Manipulação Inversa
Este é um padrão de continuação de baixa que aparece em um mercado em tendência, especificamente em uma tendência de baixa. No entanto, representa uma reversão em uma tendência de alta, com o cabo tendo uma forma de copo e cabo inverso.
Como o Padrão Inverso de Copo e Alça se Forma
- Copa: O preço traça um topo arredondado, como um “U” invertido, indicando um processo de consolidação gradual após uma tendência de baixa.
- Handle: Um leve recuo para cima ocorre, indicando interesse de compra.
- Análise: Movimentos de preço abaixo do suporte da alça indicam uma continuação da tendência de baixa.
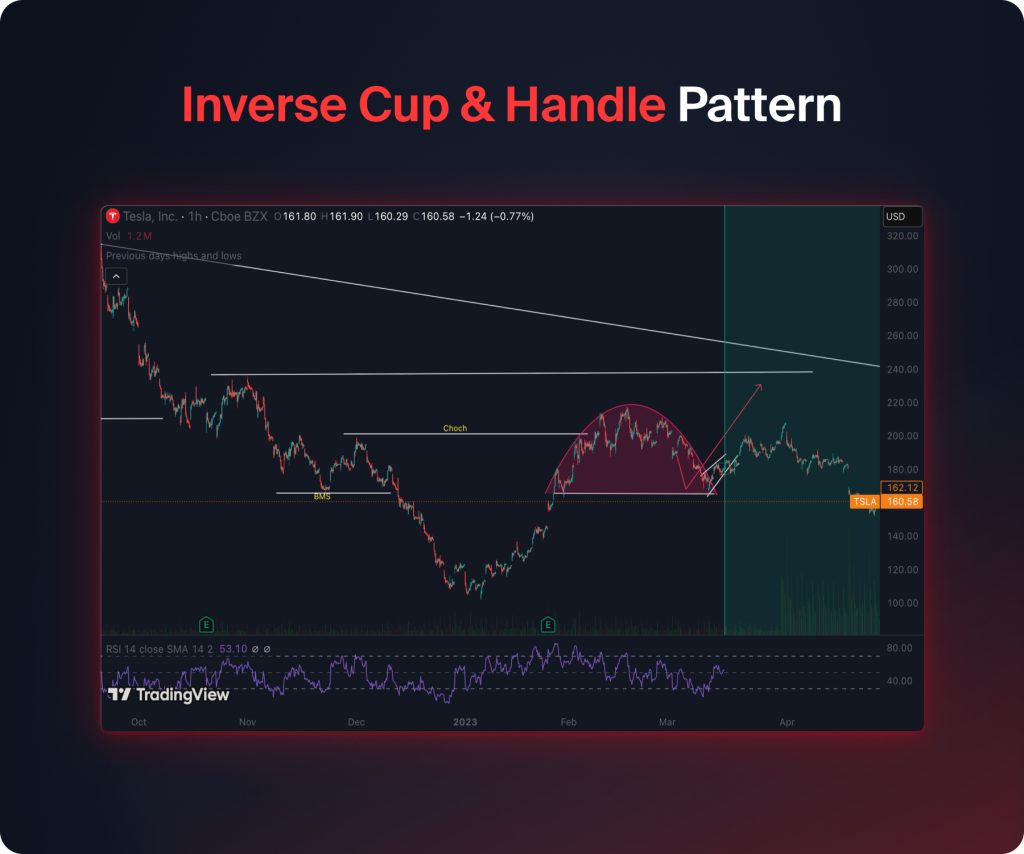
Como Negociar o Padrão Inverso de Copo e Alça
- Entrada: Entre em uma posição vendida assim que houver uma quebra confirmada abaixo do nível de suporte da alça, preferencialmente com maior volume.
- Stop Loss: Posicione o stop acima da máxima do cabo.
- Take Profit: Meça a altura da xícara invertida e estenda essa medida para baixo a partir do ponto de quebra.
23. Padrão de Compressão de Volatilidade
A compressão da volatilidade é um padrão de ruptura que indica a presença de baixa volatilidade antes de uma forte ruptura direcional. É uma área de consolidação do mercado onde as forças de compra e venda estão equilibradas, preparando assim o cenário para uma forte ruptura do mercado.
Como o Padrão de Compressão da Volatilidade se forma
- Redução da faixa de preços: Os preços se movem em uma faixa estreita, o que causa a compressão.
- Volatilidade: As Bandas de Bollinger estão encolhendo. Isso sugere que o nível de volatilidade do mercado é baixo.
- Ruptura ou Queda: Os preços são forçados a sair da faixa, geralmente de maneira maciça, do lado em que o controle foi ganho.
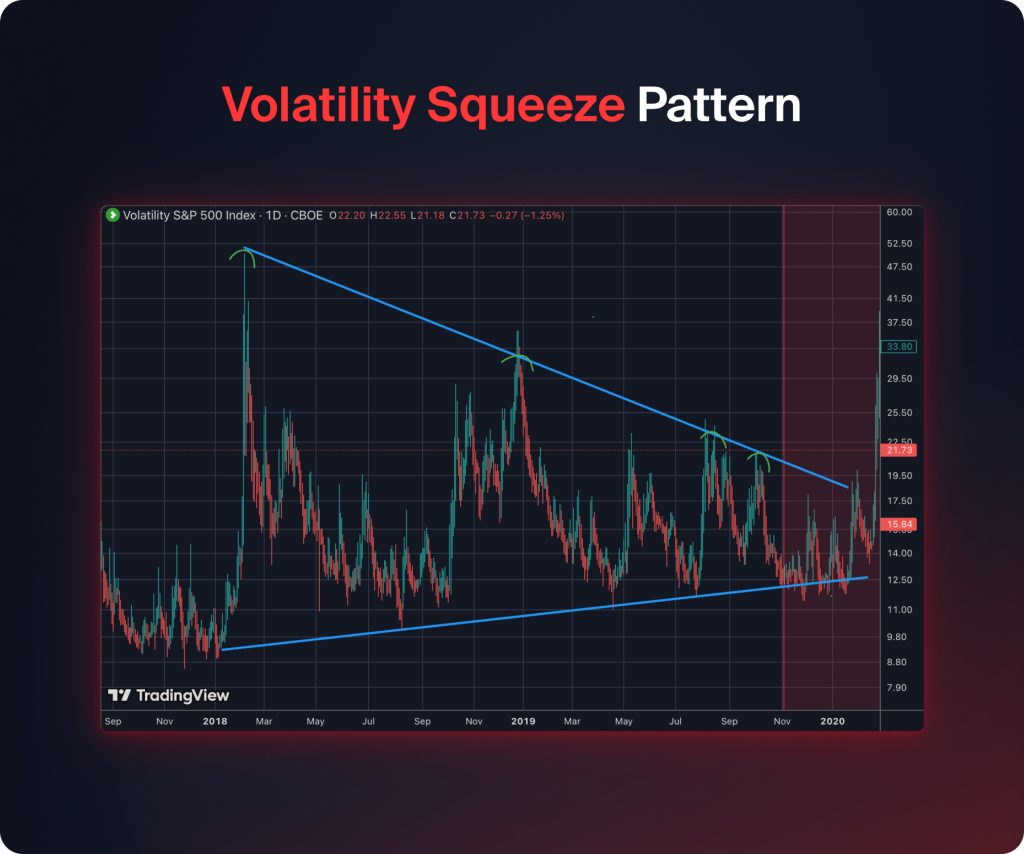
Como Negociar o Padrão de Compressão da Volatilidade
- Entrada: Para entrar, aguarde até que o preço se mova para fora da faixa de compressão na direção da ruptura, de preferência com volume crescente.
- Stop Loss: Seu stop loss deve estar dentro da compressão, abaixo do nível de suporte para operações longas e acima do nível de resistência para operações curtas.
- Take Profit: Calcule o tamanho da compressão e estenda esse valor na direção da ruptura.
24. Padrão de Bobina de Compressão de Preço
A bobina de compressão de preço é um padrão de rompimento que ocorre quando o preço se comprime em uma faixa estreita, pressagiando um grande movimento de momentum. Indica um período de incerteza e volatilidade decrescente antes que o momentum retome.
Formação do Padrão de Bobina de Compressão de Preços
Este padrão consiste nos seguintes componentes:
- Intervalo de Preço Convergente: Altos e baixos convergem, formando um padrão em espiral.
- Diminuição no Volume: O comércio geralmente é menor durante uma fase de enrolamento.
- Ruptura ou queda: Os preços saem da consolidação com um movimento forte em qualquer direção, indicando o início de uma nova tendência.
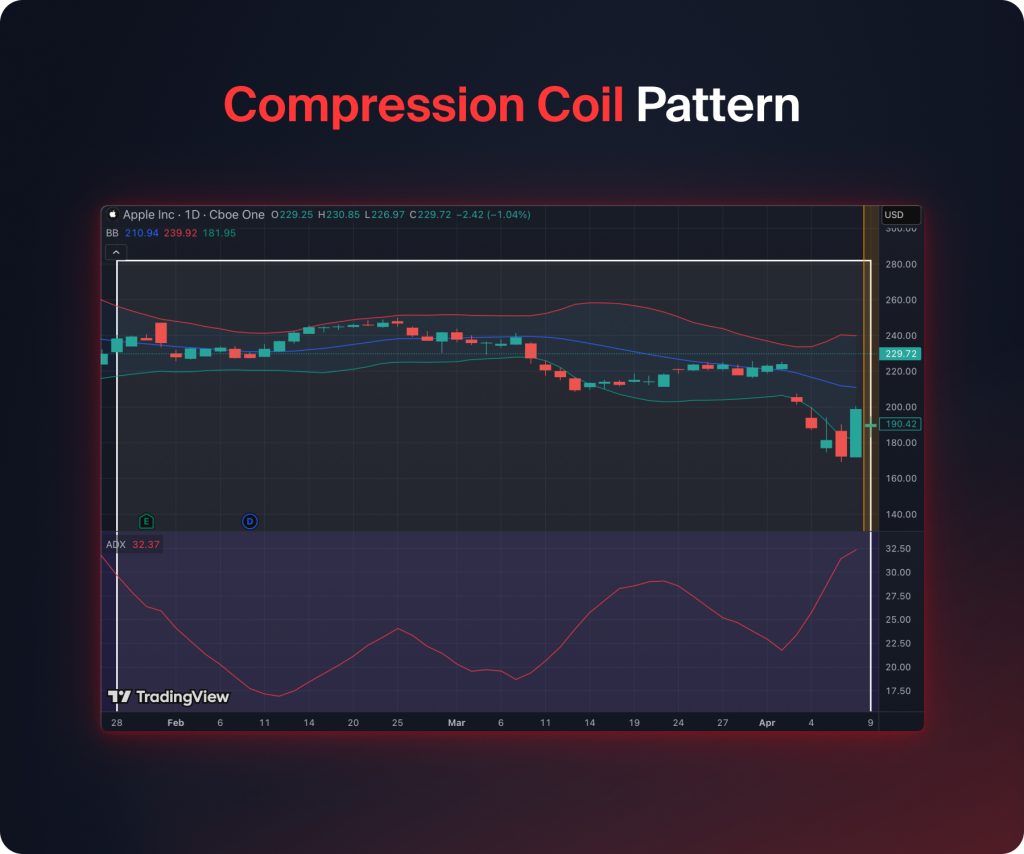
Como negociar o padrão de bobina de compressão de preço
- Entrada: Entre após uma quebra confirmada acima do nível da bobina, idealmente com volume crescente.
- Stop Loss: Posicione o nível de stop-loss imediatamente dentro da bobina do lado oposto ao rompimento.
- Take Profit: Meça a largura da bobina e estenda-a na direção da quebra.
25. Padrão de Quebra de Faixa
Este é um padrão de continuação ou reversão que ocorre quando o preço se consolida dentro de um intervalo identificado e, em seguida, explode com intensidade significativa. Denota uma situação de equilíbrio temporário do mercado, onde o mercado finalmente desenvolve uma preferência clara por uma tendência particular.
Como o Padrão de Quebra de Faixa se Forma
- Nível de Suporte: O preço mostra consistentemente interesse de compra no nível de suporte horizontal.
- Nível de Resistência: O preço enfrenta consistentemente pressões de venda ao longo de uma linha de resistência horizontal.
- Breakout / Breakdown: O preço eventualmente se move acima do nível de resistência (bullish) ou abaixo do nível de suporte (bearish).
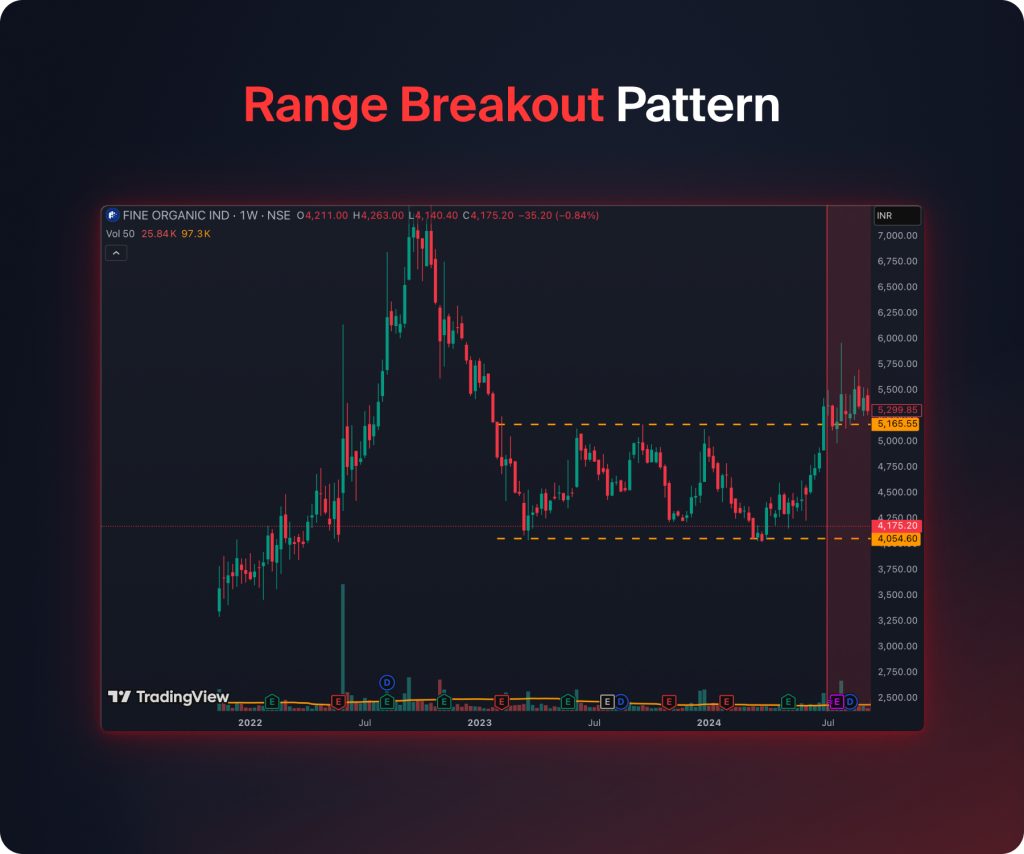
Como Negociar o Padrão de Quebra de Faixa
- Entrada: A entrada é em uma ruptura acima da resistência ou uma quebra abaixo do suporte após confirmação, preferencialmente com volumes de mercado crescentes.
- Stop Loss: Posicione o stop dentro da faixa, abaixo dos níveis de suporte em posições longas ou acima da resistência em vendas a descoberto.
- Take Profit: A altura da faixa precisa ser medida e projetada em uma direção de rompimento ou queda.
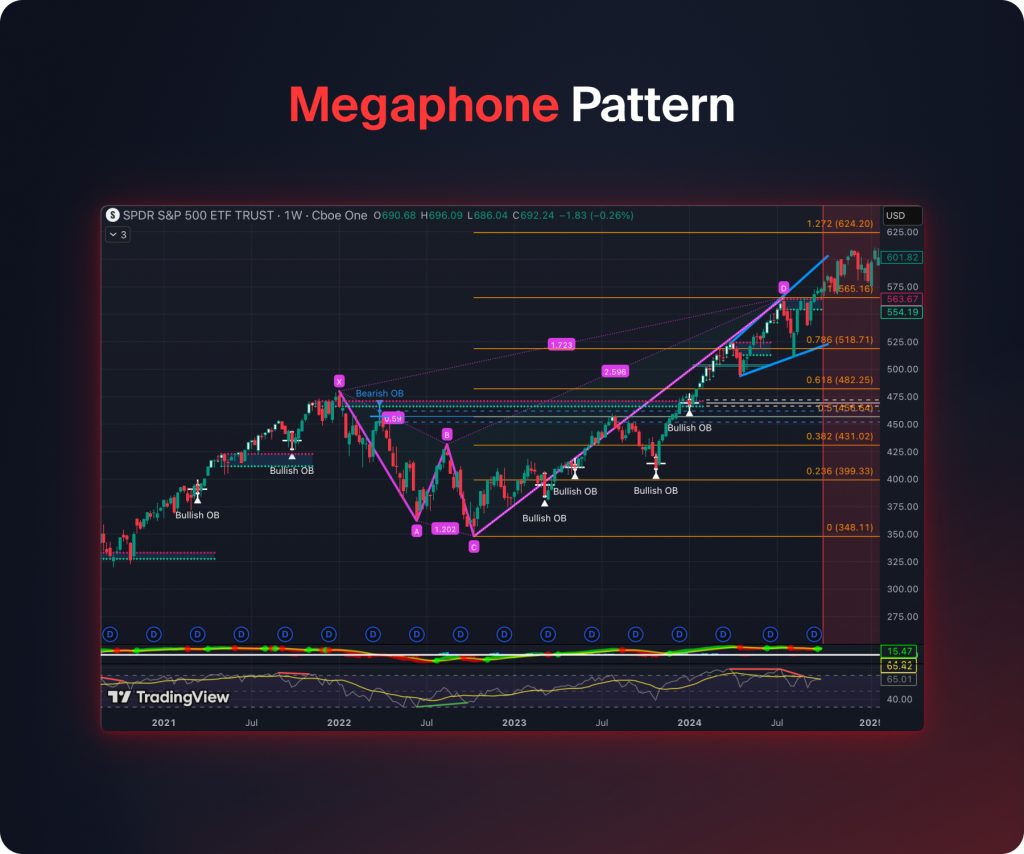
26. Ampliando a Formação (Padrão Megafone)
O padrão de formação ampla ou padrão de megafone é um padrão de expansão de volatilidade que se forma quando as oscilações de preço se alargam ao longo do tempo. É uma indicação de crescente indecisão e volatilidade do mercado, antes de um forte rompimento.
Como o Padrão de Formação Ampliada se Forma
- Abertura de Altos e Baixos: Cada alto e baixo subsequente está mais distante, formando um padrão de megafone.
- Flutuações de Volume: O volume de negociação geralmente aumenta durante cada oscilação.
- Breakout/Breakdown: O preço demonstra um forte movimento direcional para fora do padrão, indicando confirmação de momentum.
Como Negociar o Padrão de Formação de Amplitude
- Entrada: Engaje na negociação na direção correta da quebra após a confirmação, idealmente com o benefício da participação do volume.
- Stop Loss: Posicione o stop dentro do padrão, atrás do swing high ou low mais próximo do lado oposto do ponto de ruptura.
- Take Profit: A distância do primeiro pico de alta ao primeiro fundo de baixa será medida e, em seguida, projetada na direção da quebra.
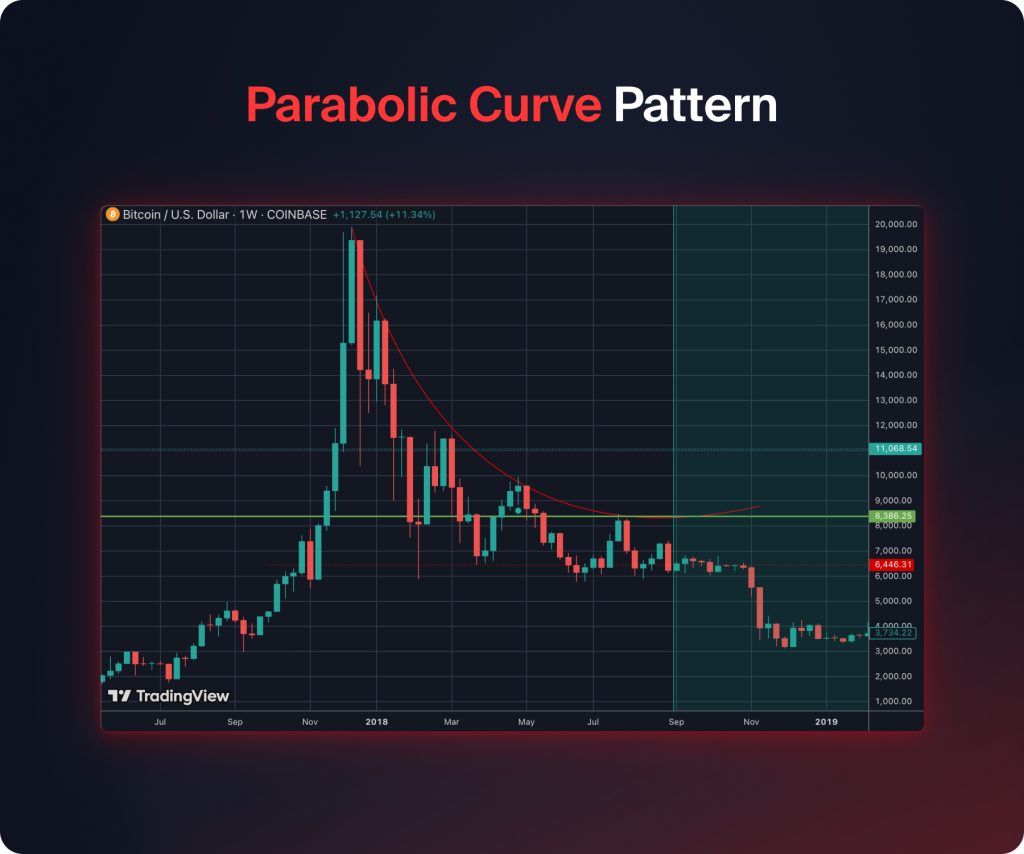
27. Padrão de Curva Parabólica
A curva parabólica é um padrão de expansão de volatilidade que ocorre como resultado de movimentos de preço acelerados em uma direção, resultando em uma curva exponencial. O padrão é uma indicação de um impulso notável. Ele sinaliza um forte impulso e muitas vezes precede uma reversão acentuada ou continuação, dependendo do contexto do mercado. Este padrão reflete um entusiasmo extremo de compra ou venda.
Como o Padrão da Curva Parabólica se Forma
- Tendência Acentuada: O preço se move em um padrão parabólico com forte momentum.
- Ponto de Exaustão: A velocidade diminui quando compradores/vendedores atingem um ponto extremo, indicando uma possível reversão ou consolidação no mercado.
- Confirmação: Um rompimento na direção da tendência ou uma reversão indica confirmação do padrão.
Como Negociar o Padrão de Curva Parabólica
- Entrada: Entre em uma negociação na direção do movimento parabólico se a tendência persistir, ou esteja preparado para reverter se um sinal confirmado de exaustão for gerado.
- Stop Loss: Defina o stop logo além do ponto extremo da curva.
- Take Profit: Avalie a corrida inicial antes da acentuada aceleração da curva e estenda-a para o futuro, levando em consideração as considerações de mercado.
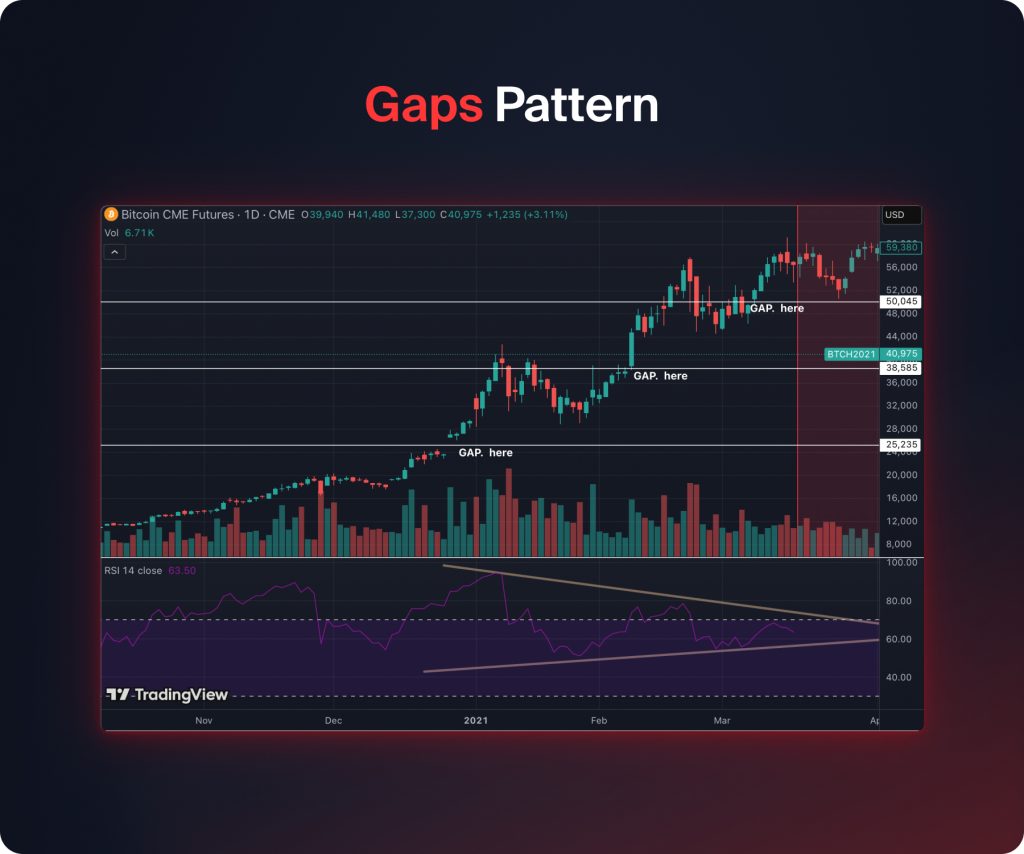
28. Padrão de Lacunas
Um Padrão de Gaps pode ser um padrão de reversão ou de rompimento, formado quando o mercado abre com um gap acima ou abaixo do fechamento anterior por um valor significativo. Este tipo de padrão representa uma mudança abrupta no sentimento do mercado em resposta a notícias ou anúncios de lucros.
Como o Padrão de Lacunas se Forma
- Gap Up / Gap Down: O ativo abre mais alto (Gap Up) ou mais baixo (Gap Down) do que o fechamento anterior, resultando em uma lacuna visível no gráfico.
- Continuação ou Reversão: Os gaps podem representar continuações ou reversões nos movimentos de preços, como nos gaps de rompimento ou gaps de exaustão.
- Confirmação: A ação do preço que preenche o gap ou se estende além do gap confirma o padrão.
Como Negociar o Padrão de Lacunas
- Entrada: Faça uma operação na direção do gap se o momentum persistir, ou opere o preenchimento do gap se a reversão indicada pela análise técnica for confirmada.
- Stop Loss: Posicione o stop loss ligeiramente abaixo do gap para uma operação longa e ligeiramente acima para uma operação curta.
- Take Profit: Meça o tamanho do intervalo ou dos níveis de oscilação anteriores para as metas de lucro.
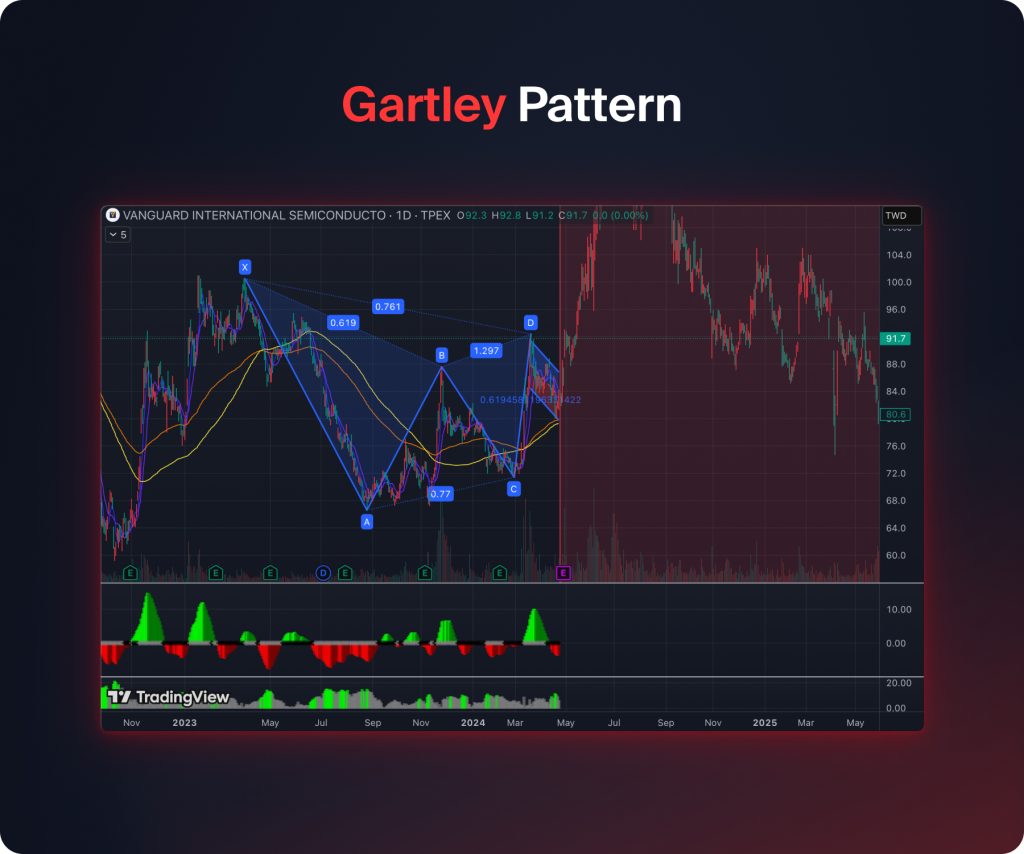
29. Padrão Gartley
O Padrão Gartley é um padrão de reversão que inclui o uso de níveis de retração de Fibonacci para identificar prováveis pontos de reversão do mercado. Este padrão pode ser de baixa ou de alta.
Como o Padrão Gartley se Forma
- X-A Perna: O movimento de tendência inicial.
- A-B Perna: Retração de X-A, geralmente 61,8% de X-A.
- B-C: Retrocesso de A-B, entre 38.2% e 88.6%
- C-D Leg: Último movimento que completa o padrão; projetando reversão em 78,6% de retração de X-A.
Como Negociar o Padrão Gartley
- Entrada: Após identificar sinais de reversão, entre em uma negociação no ponto D.
- Stop-Loss: Posicione o stop loss ligeiramente além do ponto X.
- Take Profit: Use a extensão de Fibonacci ou os máximos e mínimos anteriores para definir metas.
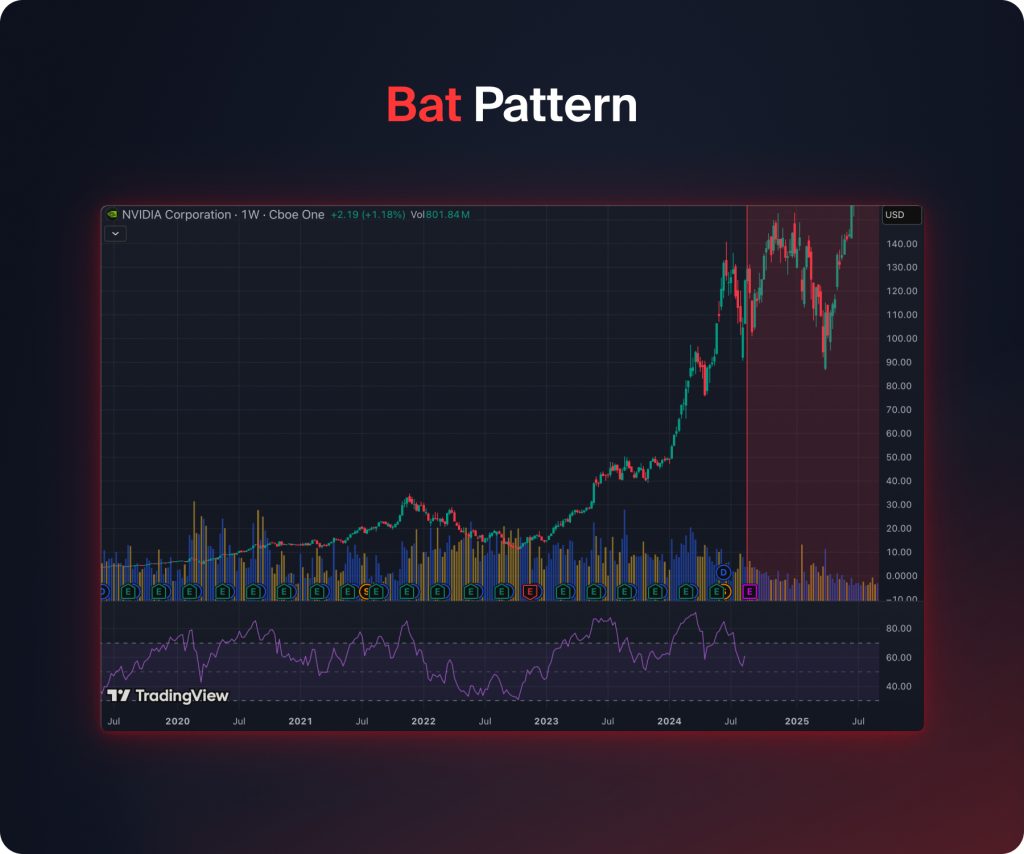
30. Padrão Bat
O Padrão Bat é outro padrão de reversão que é semelhante ao Padrão Gartley, mas apresenta níveis de retrocesso mais profundos. Esse padrão também alerta para uma reversão de alta probabilidade uma vez concluído.
Como o Padrão de Morcego se Forma
- X-A Perna: Movimento inicial.
- A-B Perna: Retração de X-A, tipicamente 38,2%–50%.
- B-C Perna: Retração de A-B, geralmente 38,2%–88,6%.
- C-D Leg: Conclusão em 88,6% de retração de X-A, indicando potencial reversão.
Como Negociar o Padrão Bat
- Entrada: Entrar no ponto D após a confirmação da reversão.
- Stop Loss: Defina ligeiramente além de X.
- Take Profit: O alvo pode ser medido em oscilações anteriores ou extensões de Fibonacci.
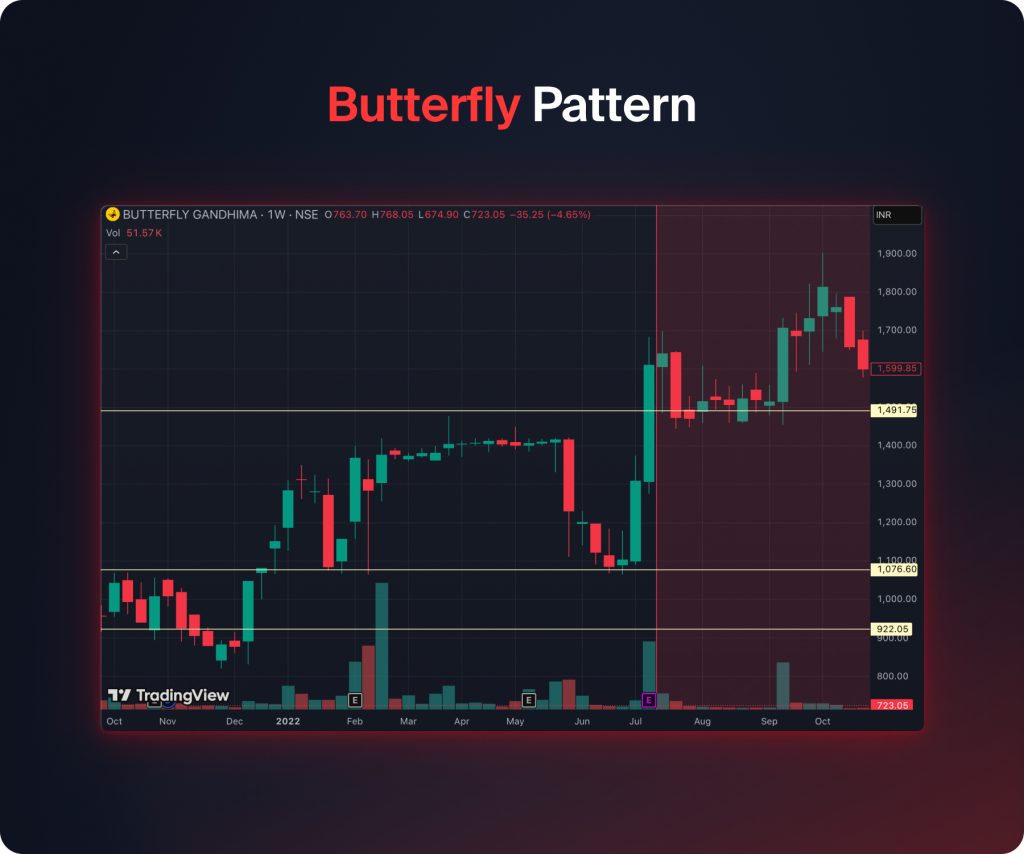
31. Padrão Borboleta
O padrão borboleta é um padrão de reversão que aparece no final de uma tendência, dependendo dos níveis de extensão de Fibonacci para pontos de entrada precisos. É uma indicação de exaustão da tendência, o que significa que uma reversão é provável que aconteça.
Como o Padrão da Borboleta se Forma
- X-A Perna: Movimento de tendência inicial.
- A-B Leg: Retração de X-A, geralmente 78,6%.
- B-C Perna: Retração de A-B, tipicamente 38,2%–88,6%.
- C-D Leg: Extensão além de X, geralmente 127%–161,8%, marcando a zona de reversão.
Como Negociar o Padrão Borboleta
- Entrada: Entre em uma negociação no ponto D após identificar sinais de reversão.
- Stop Loss: Posição logo além do ponto D.
- Take Profit: Retração de Fibonacci do trecho C-D ou pontos de oscilação anteriores.
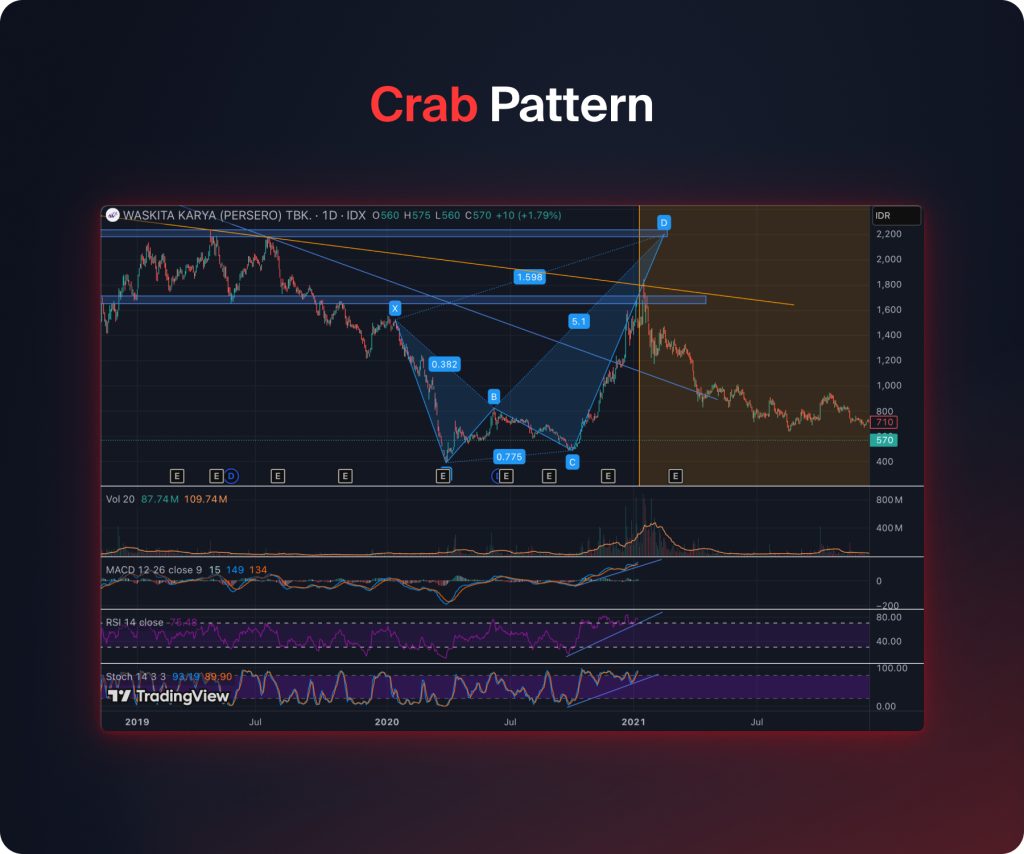
32. Padrão de Caranguejo
O Padrão Caranguejo é um padrão de reversão extremo com uma longa perna C-D, projetado para uma entrada precisa no final da tendência. É altamente preciso se medido corretamente com as razões de Fibonacci.
Como o Padrão de Caranguejo se Forma
- X-A Perna: Movimento de tendência inicial.
- A-B Perna: Retração de X-A, normalmente 38,2%–61,8%.
- B-C Perna: Retração de A-B, geralmente 38,2%–88,6%.
- C-D Perna: Extensão para 161,8% de X-A, formando a zona de reversão.
Como Negociar o Padrão de Caranguejo
- Entrada: Entre no ponto D após a confirmação da reversão.
- Stop Loss: Coloque ligeiramente além de D.
- Take Profit: Use as extensões de Fibonacci da perna C-D ou pontos de swing anteriores.
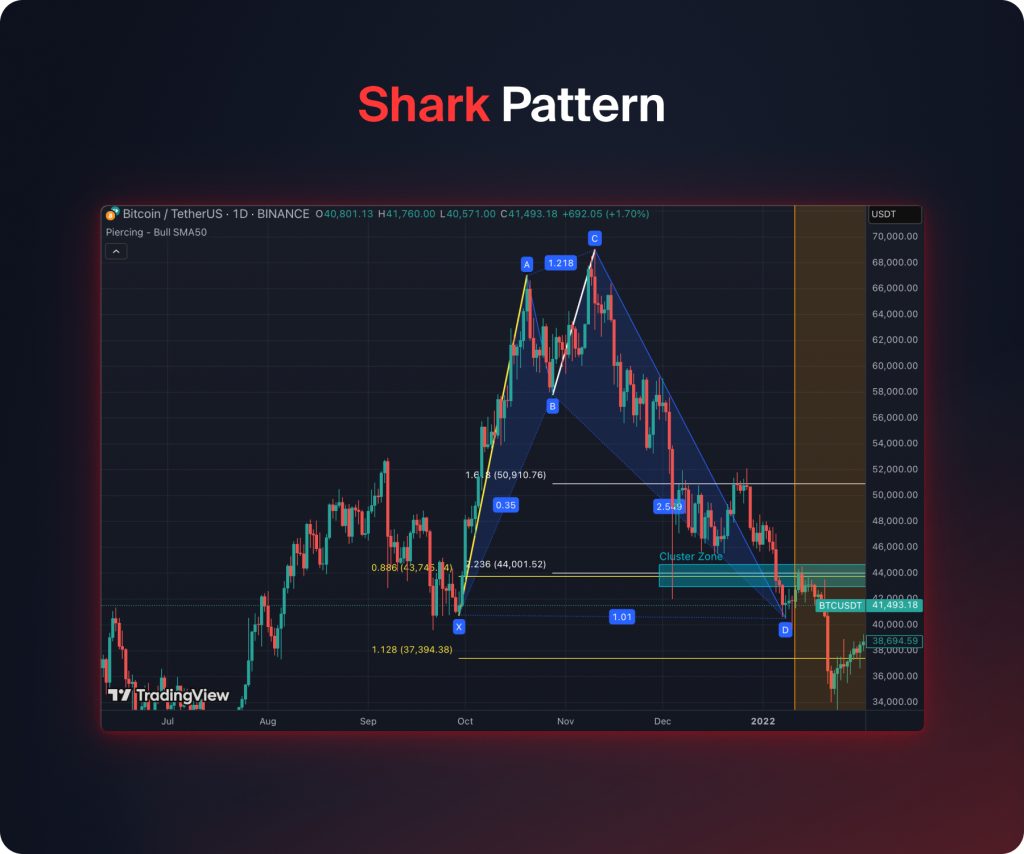
33. Padrão de Tubarão
O padrão tubarão é um padrão de reversão que faz uso do padrão harmônico de reversão para prever mudanças na tendência do mercado através da aplicação de razões de Fibonacci. O Padrão Tubarão ocorre em ou perto dos extremos das oscilações de preço.
Como o Padrão de Tubarão se Forma
- Ponto O-X: A forte movimentação de preço inicial, a perna de impulso.
- Ponto X-A: Um retrocesso da perna O-X, tipicamente de 38,2% a 61,8%.
- Ponto A-B: Uma retração ou extensão mais profunda, geralmente de 113% a 161,8% da perna X-A.
- Ponto B-C: A etapa final que completa o padrão, muitas vezes uma extensão da etapa O-X (113% a 224%) e se estendendo além do ponto A.
- Zona de Reversão Potencial (PRZ): A área ao redor do ponto C onde o padrão se completa e uma reversão é esperada, definida pela confluência dos níveis de Fibonacci
Como Negociar o Padrão de Tubarão
- Entrada: Compre quando o preço subir a partir de C, geralmente na abertura da próxima vela após a confirmação. No entanto, venda quando o preço cair a partir de C, usando uma confirmação semelhante.
- Stop Loss: Coloque seu stop loss logo abaixo de C (para alta) ou acima de C (para baixa), ou na extensão de 113% de Fibonacci de XA para maior segurança.
- Take Profit: 50% a 61.8% de retração do segmento BC ou do segmento XA ou a extensão de 1.618 do segmento BC.
34. Wolfe Wave (Bullish)
A onda wolfe de alta é um padrão de reversão e continuação, que denota um forte avanço nos preços uma vez que cinco ondas específicas são formadas em um padrão refletindo os ritmos naturais do mercado e o equilíbrio entre oferta e demanda.
Como se Forma a Onda Wolfe Altista
- Onda 1-5: O preço forma cinco ondas, com a onda 5 completando na linha de tendência que conecta as Ondas 1 e 3.
- Reversão: O preço sobe em direção à linha de alvo que conecta as Ondas 1 e 4.
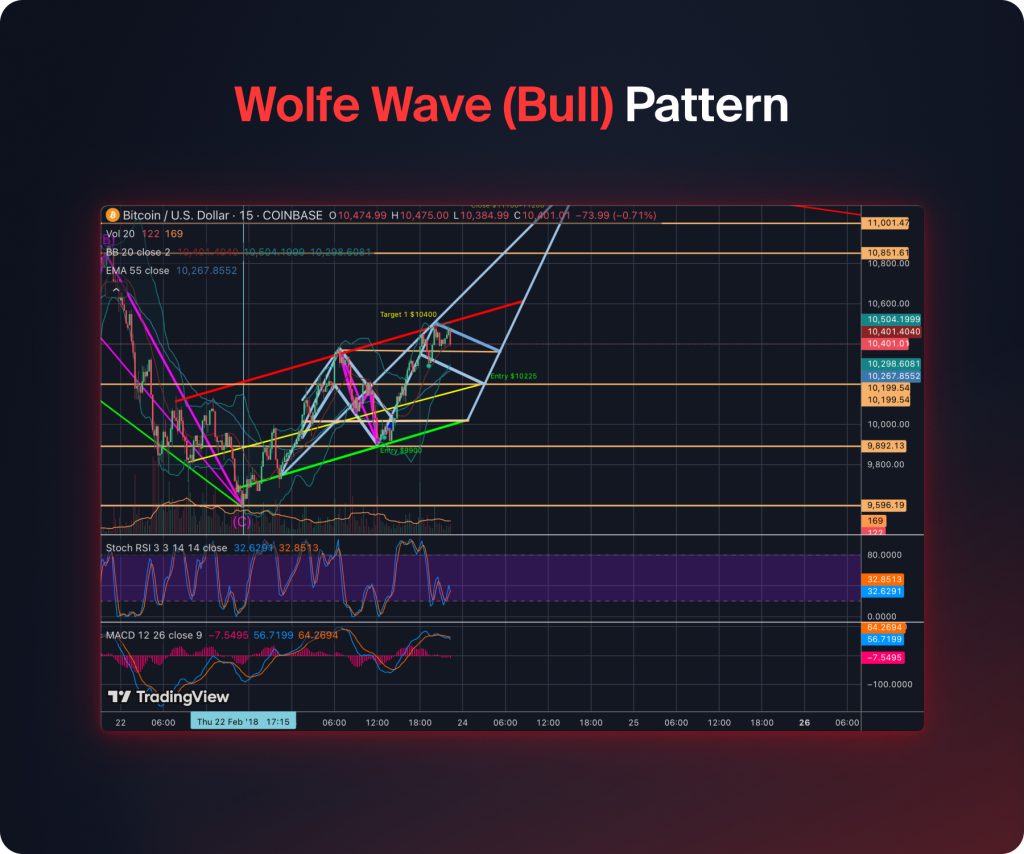
Como Negociar uma Onda Wolfe Bullish
- Entrada: Entre em uma operação longa em torno da onda 5.
- Stop Loss: coloque abaixo do mínimo da Onda 5.
- Take Profit: Linha de alvo das ondas 1 a 4, ou extensões de Fibonacci.
35. Wolfe Wave (Baixista)
As ondas Wolfe baixistas são o oposto das Ondas Wolfe altistas, indicando uma forte tendência de baixa. Elas aparecem após uma tendência de cinco ondas, indicando uma previsão de queda de preço.
Formação da Onda Wolfe Baixista
- Onda 1-5: O preço faz cinco ondas, com a onda 5 próxima à linha que une as Ondas 1 & 3.
- Reversão: O preço cai em direção à linha de alvo desenhada entre as Ondas 1 e 4.
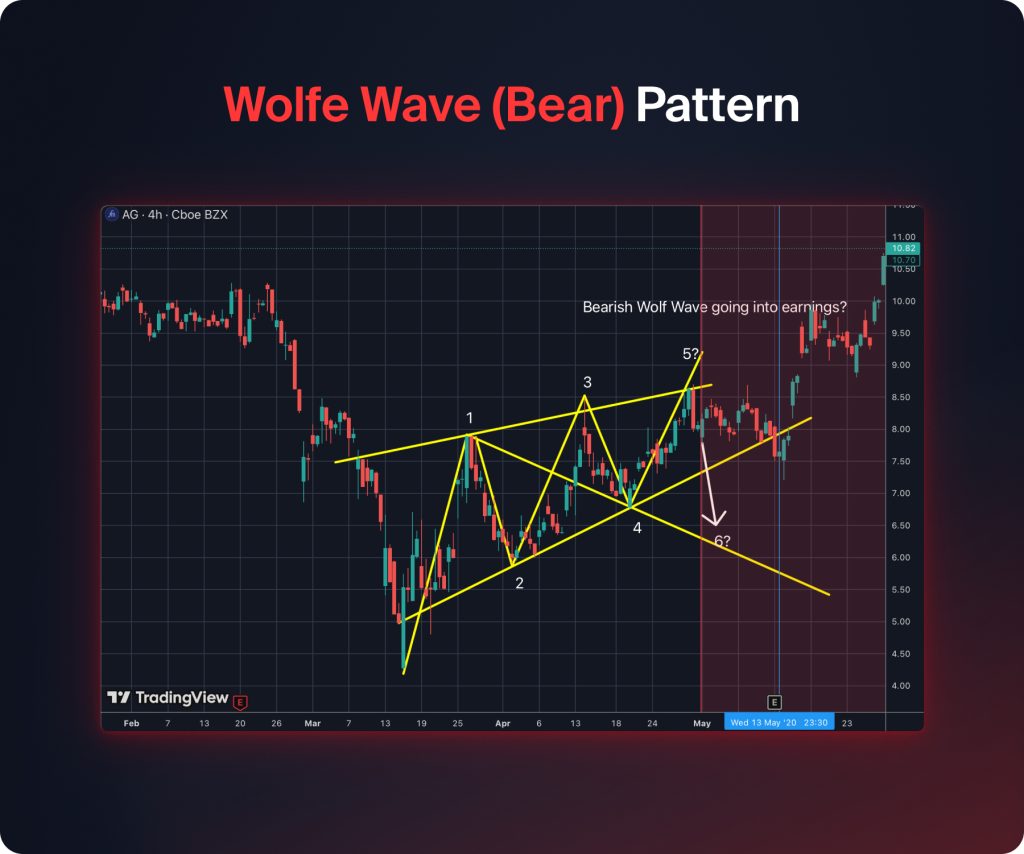
Como Negociar a Onda Wolfe Baixista
- Entrada: Faça uma negociação ao redor do ponto da onda 5.
- Stop Loss: Posição acima da alta da onda 5.
- Take Profit: Linha alvo das ondas 1 a 4, ou use extensões de Fibonacci.
36. Altos mais altos & baixos mais altos
Isso sinaliza uma tendência extremamente forte no ativo, que neste caso é uma tendência de alta, já que cada alta tem sido maior que a anterior, com as baixas também sendo mais altas.
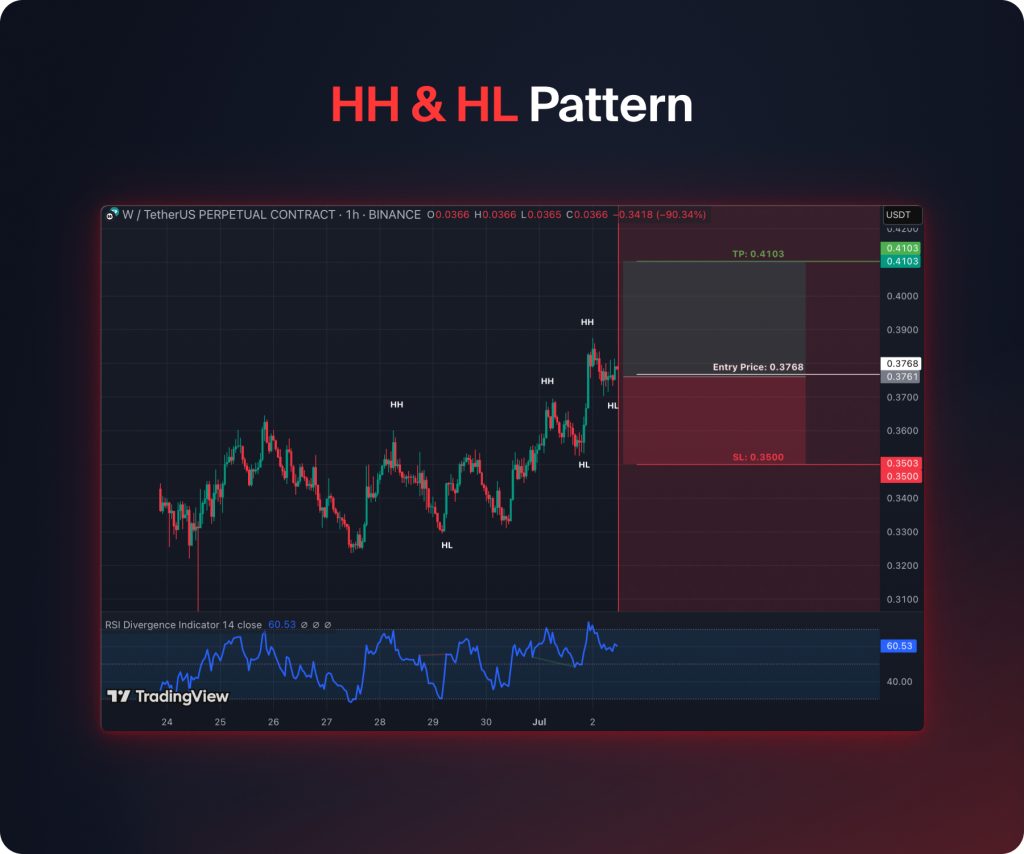
Como Negociá-lo
- Entrada: Compre na correção para mínimas mais altas com um stop loss abaixo da mínima anterior.
- Take Profit: Pode ser baseado na tendência ou em pontos de resistência importantes.
37. Máximas Decrescentes & Mínimas Decrescentes
Este padrão mostra que a tendência de baixa é forte. Cada alta sucessiva é menor que a anterior, e cada baixa também é menor, mostrando que os vendedores estão no controle.
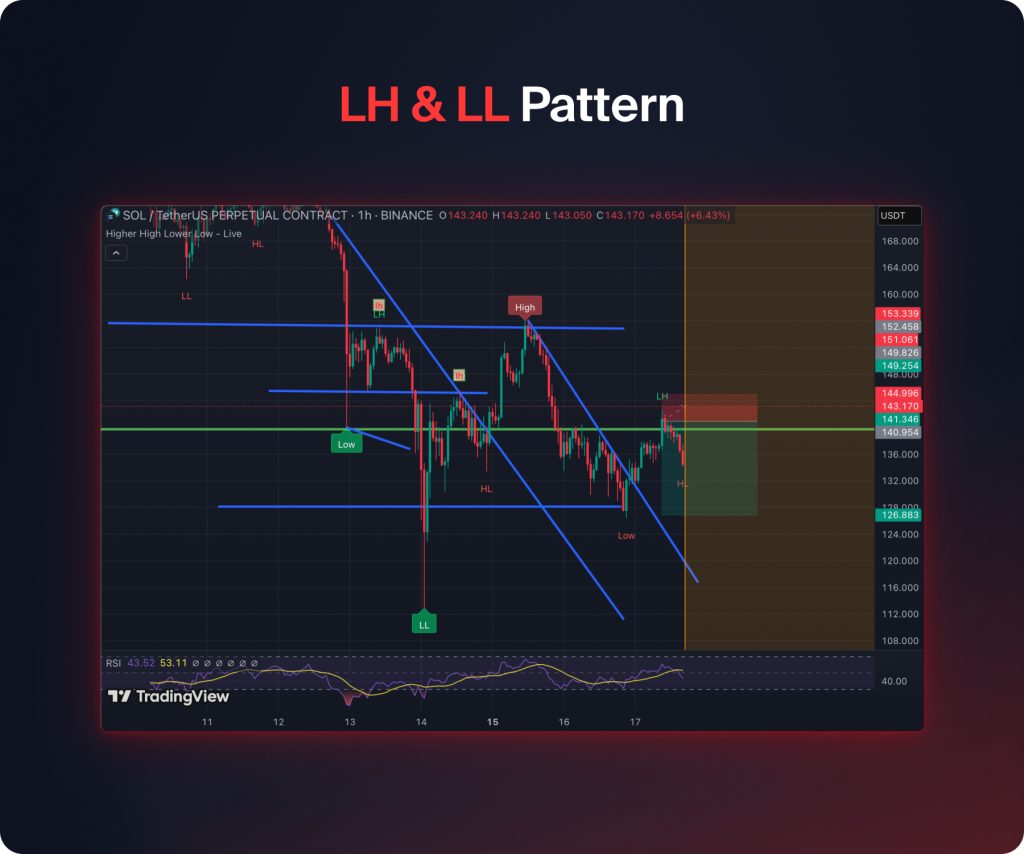
Como Negociá-lo
- Entrada: Curto em rallies para máximas mais baixas com uma ordem de stop loss acima das máximas anteriores.
- Meta de Lucro: Siga a tendência ou níveis de suporte importantes.
38. Quebra de Estrutura (BOS)
A quebra de estrutura refere-se ao momento em que o preço quebra um nível significativo de alta ou baixa, indicando uma possível mudança ou extensão no mercado.
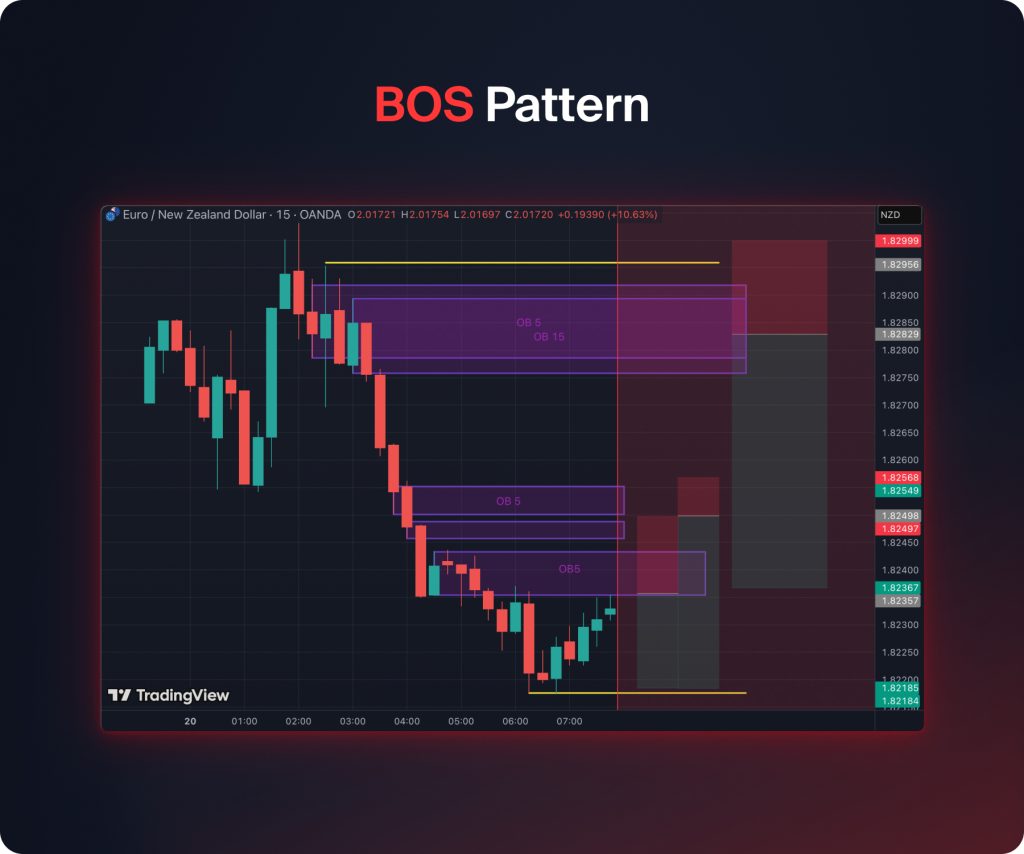
Como Negociá-lo
- Entrada: Entrar na direção do BOS após uma retração em um ponto de máxima anterior.
- Stop loss: Coloque além do ponto de oscilação anterior.
- Take profit: Os alvos dependem dos pontos de oscilação anteriores.
39. Mudança de Caráter (ChoCH)
O padrão de Mudança de Caráter sinaliza uma mudança de comportamento de altista para baixista, ou vice-versa. Frequentemente, precede rompimentos ou reversões, e é caracterizado pela falha em formar uma nova máxima (para a tendência de alta) ou uma nova mínima (para a tendência de baixa). Em vez disso, ocorre uma violação do nível de swing anterior (máxima-mínima ou mínima-máxima), geralmente indicada por uma mínima mais alta ou uma máxima mais baixa, significando que compradores ou vendedores perdem domínio e podem iniciar uma nova tendência de mercado.
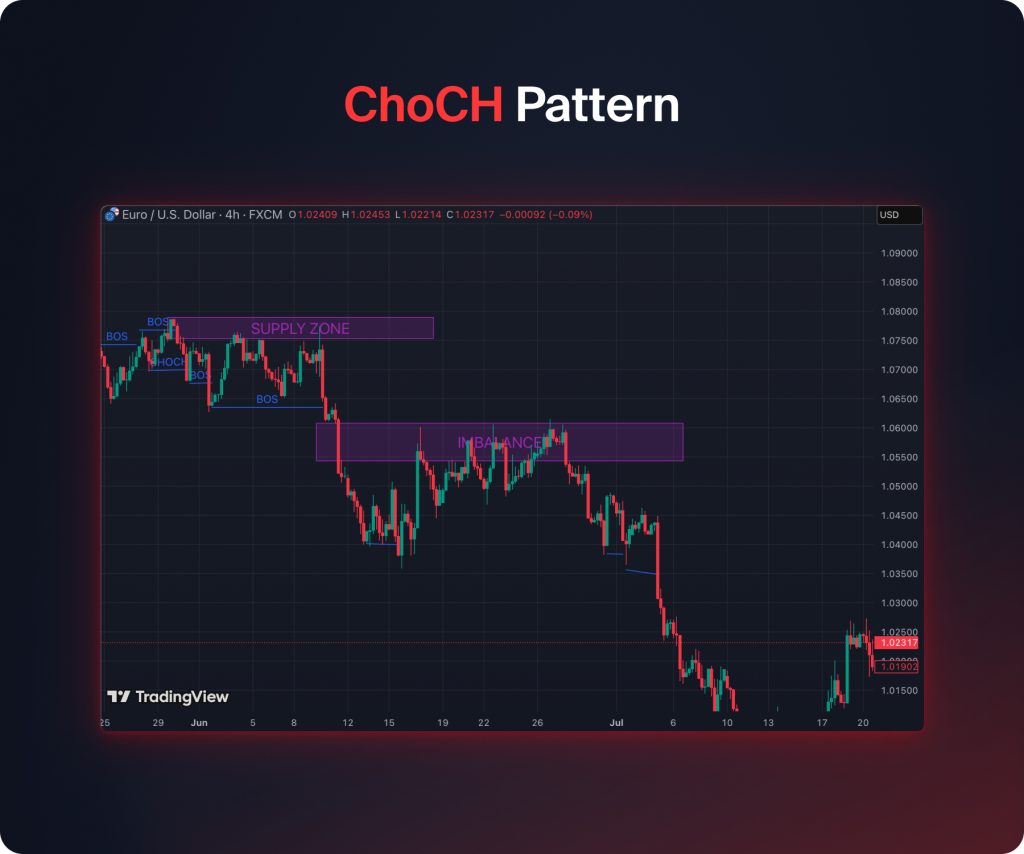
Como Negociá-lo
- Entrada: Entrar após a confirmação do ChoCH com o fechamento da vela
- Stop loss: Coloque além do ponto de reversão.
- Take Profit: Os alvos de lucro podem ser os máximos/mínimos anteriores.
40. Alturas Iguais
Alturas Iguais se formam quando o preço testa um nível de resistência várias vezes, mas não consegue romper para cima. Isso geralmente sinaliza acumulação de liquidez acima das altas.
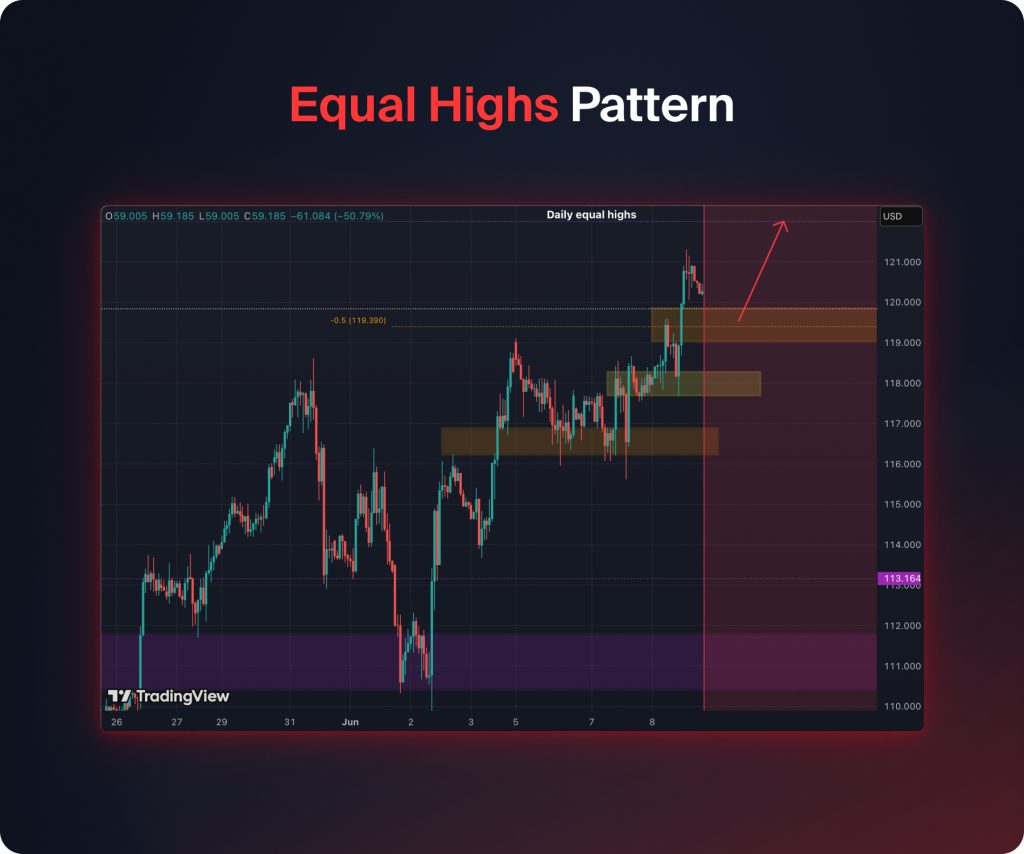
Como Negociar
- Entrada: Entrar em uma reversão confirmada de resistência.
- Stop Loss: Colocar logo acima da resistência.
- Take Profit: Alvo um ponto de oscilação anterior.
41. Lows Iguais
Fundos iguais ocorrem quando o preço testa o suporte várias vezes, mas não consegue romper para baixo. Isso indica demanda de liquidez no suporte.
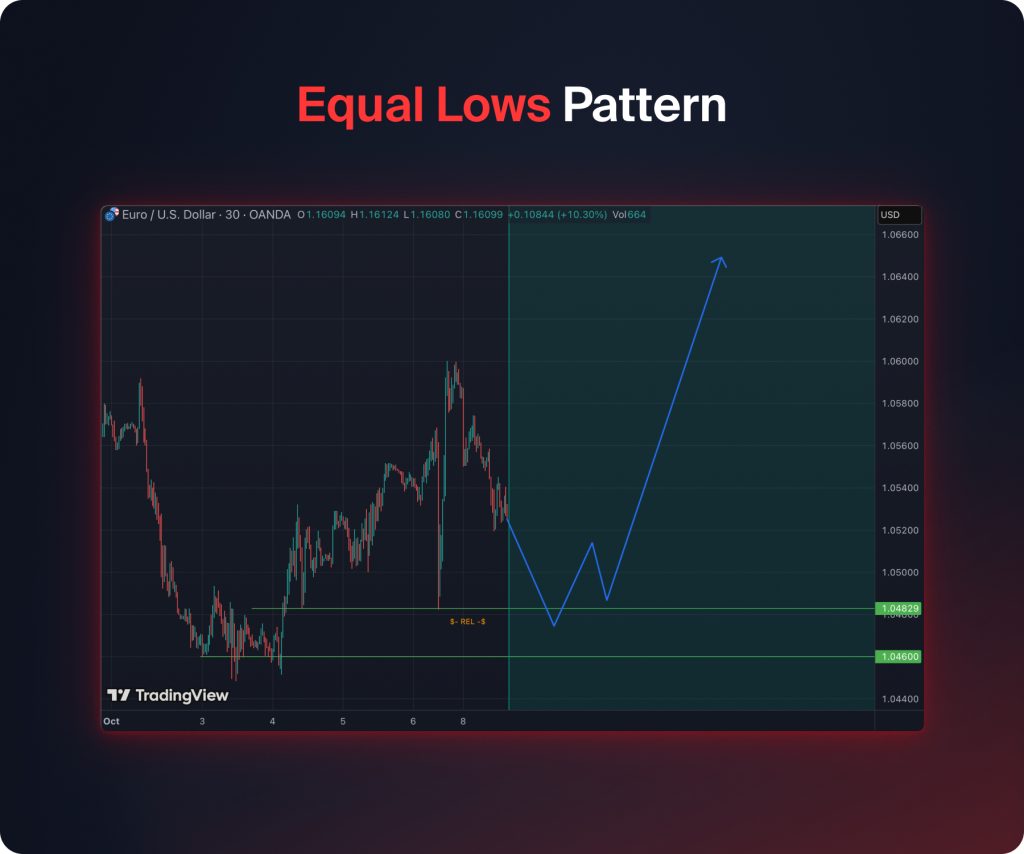
Como Negociar
- Entrada: Entrar em uma reversão confirmada a partir do suporte.
- Stop loss é colocado abaixo do suporte.
- Take Profit: Alvo um ponto de oscilação anterior.
42. Varredura de Liquidez
Uma varredura de liquidez acontece quando o preço se move além de máximas ou mínimas chave para capturar ordens de stop, e então reverte. Isso reflete manipulação por grandes participantes do mercado.
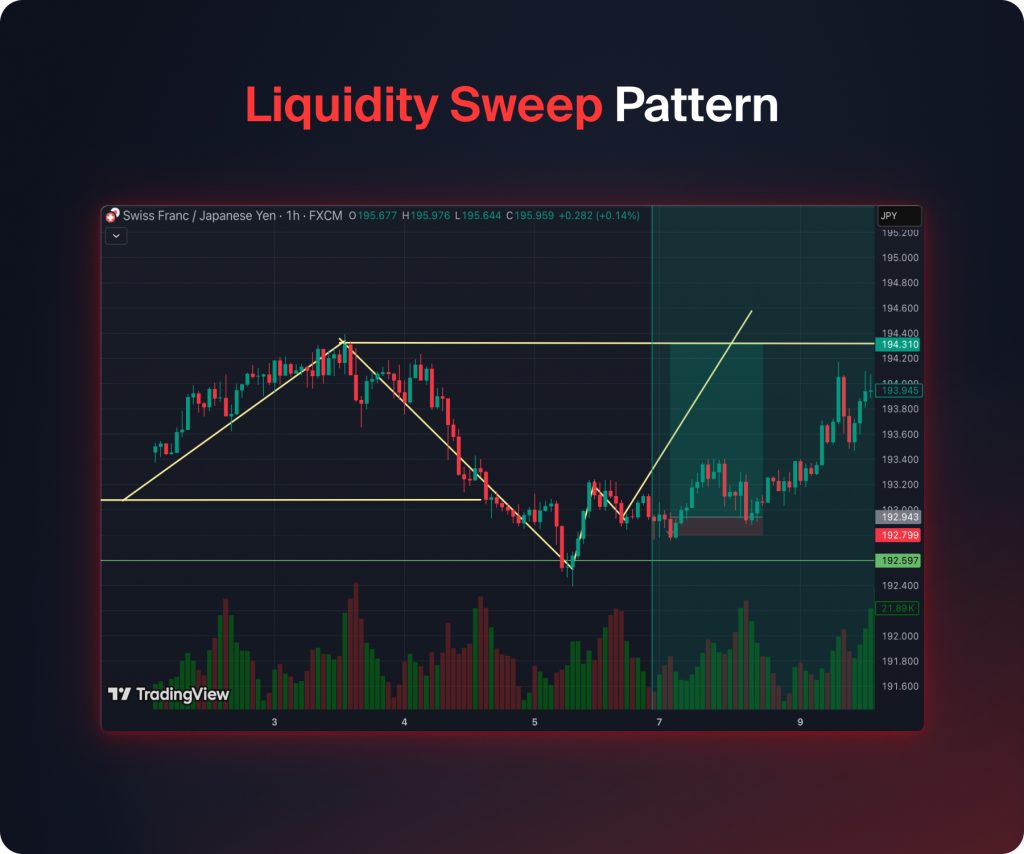
Como Negociá-lo
- Negocie na direção oposta ao movimento após a confirmação.
- Coloque o stop loss além do extremo do sweep e projete o lucro com base nas estruturas de swing anteriores.
43. Reversão de Stop-Hunt
A Reversão de Stop-Hunt é um padrão onde o preço aciona ordens de stop para criar momento, e então inverte de forma acentuada. É comum em torno de suporte/resistência.
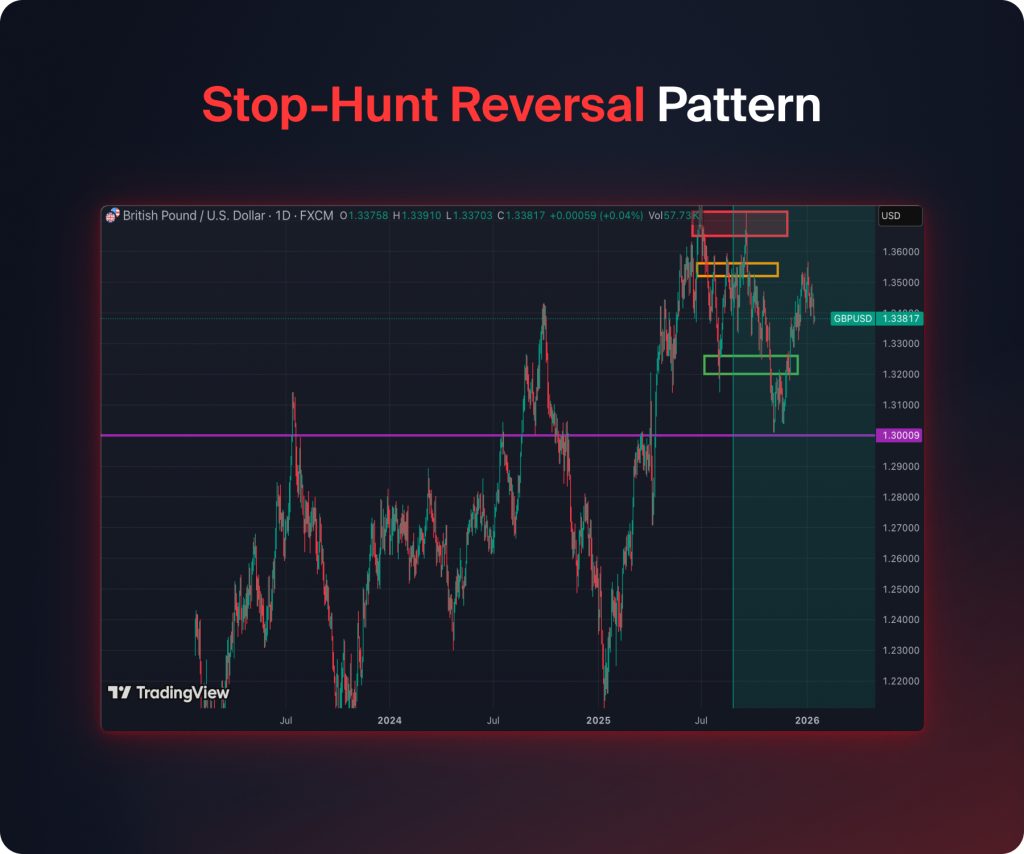
Como Negociar
- Entrada: Entre após a confirmação da vela de reversão.
- Stop loss é colocado além do extremo da caça ao stop, com metas de lucro em máximas/mínimas de swing.
44. Fuga Falsa
Um falso rompimento ocorre quando o preço quebra temporariamente um nível, mas rapidamente se inverte, prendendo os traders de rompimento. Ele reflete um falso momento antes do verdadeiro movimento.
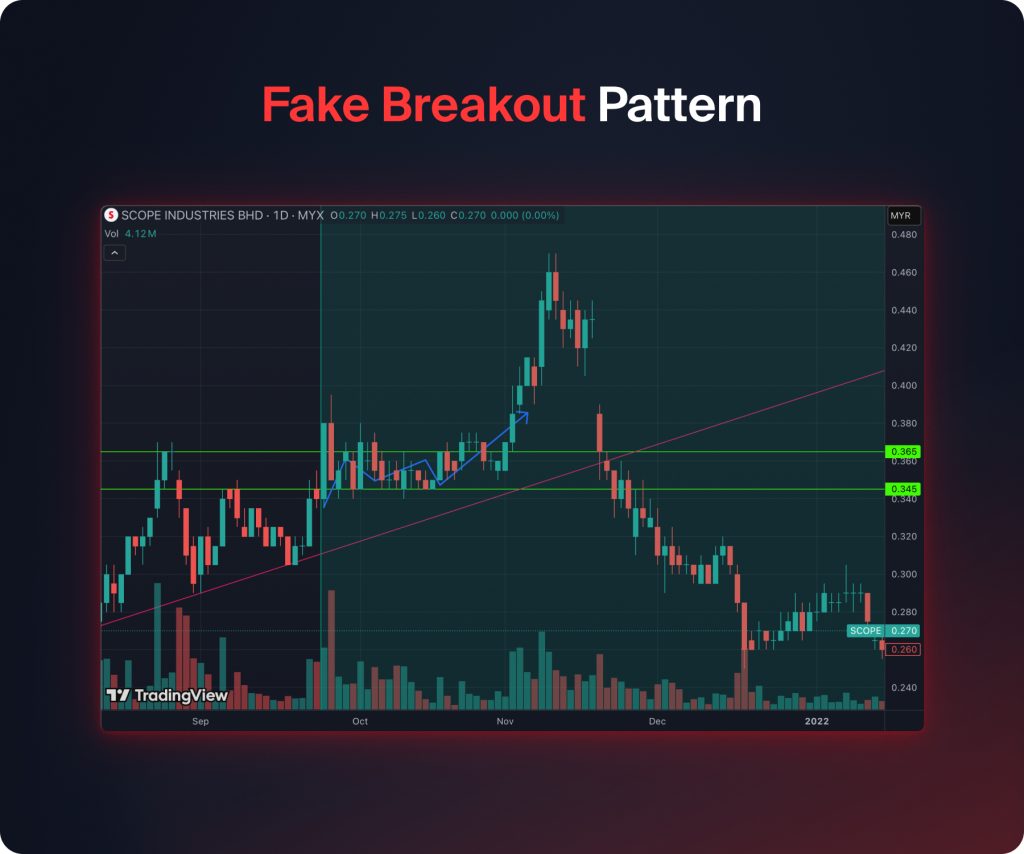
Como Negociá-lo
- Negocie na direção do verdadeiro rompimento após a confirmação.
- Stop loss está além do extremo da falsificação de rompimento, e alvos de lucro seguem os níveis de oscilação anteriores ou movimentos medidos.
45. Padrão Bump and Run
O Padrão Bump and Run sinaliza um movimento impulsivo seguido de uma correção acentuada. Reflete a exuberância excessiva dos traders antes que o mercado se corrija.
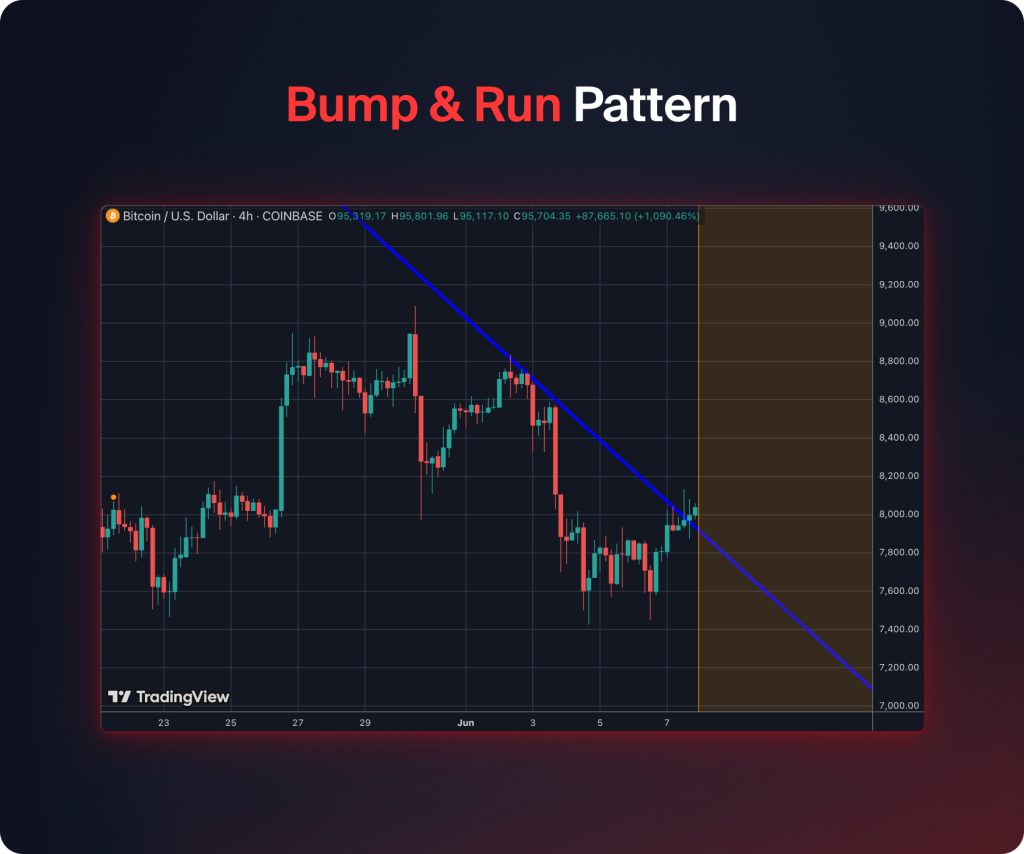
Como Negociá-lo
- Entrada: Entre na direção oposta ao “bump” após a confirmação da reversão.
- Stop loss é colocado além do extremo do bump.
- Take Profit: Os alvos são medidos pelo tamanho do aumento projetado na reversão.
46. Padrão Quasimodo
O padrão quasimodo é um padrão de reversão que é marcado por uma sequência de máximas mais altas e mínimas mais altas, que são então seguidas por uma máxima mais baixa, indicando uma mudança de tendência.
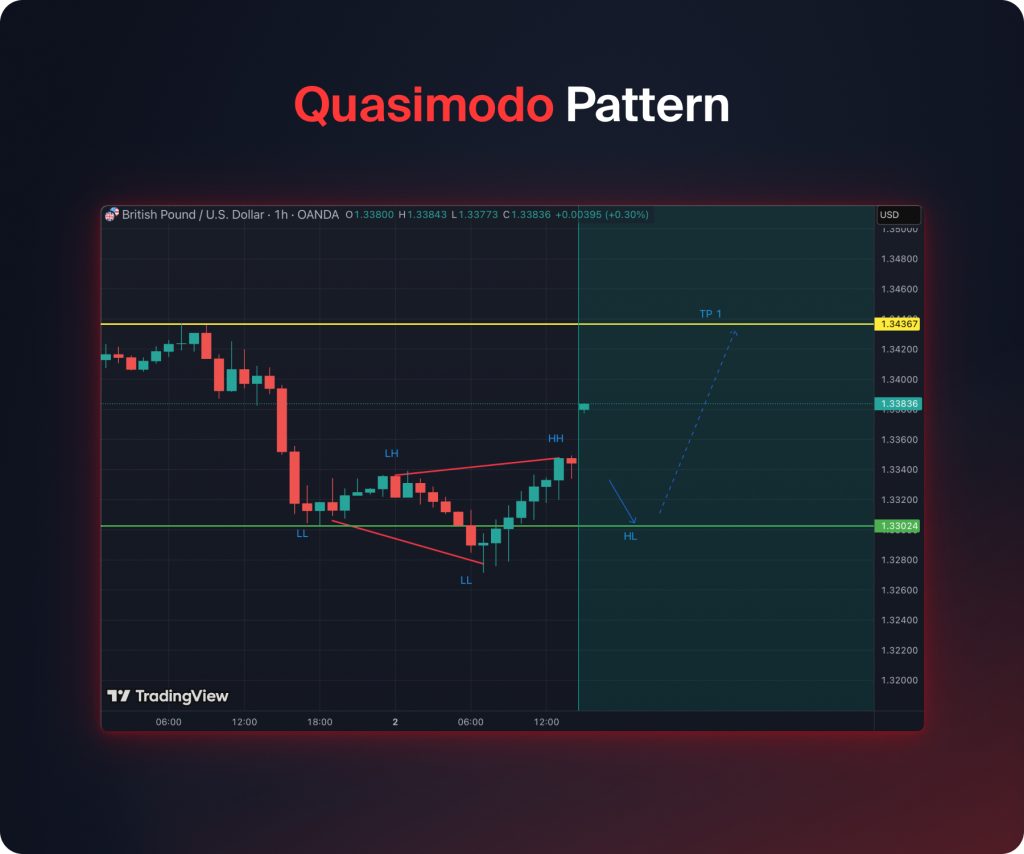
Como Negociá-lo
- Entrada: Entre após o preço quebrar a confirmação do fundo mais baixo.
- Stop loss está acima da máxima inferior (o “ombro” de Quasimodo), com metas de lucro nos níveis de suporte anteriores ou de movimento medido.
47. Padrão dos Três Movimentos
O padrão de três drives é um padrão de reversão que consiste em três oscilações de preço simétricas consecutivas com extensões de Fibonacci específicas. Ele sinaliza a exaustão da tendência atual.
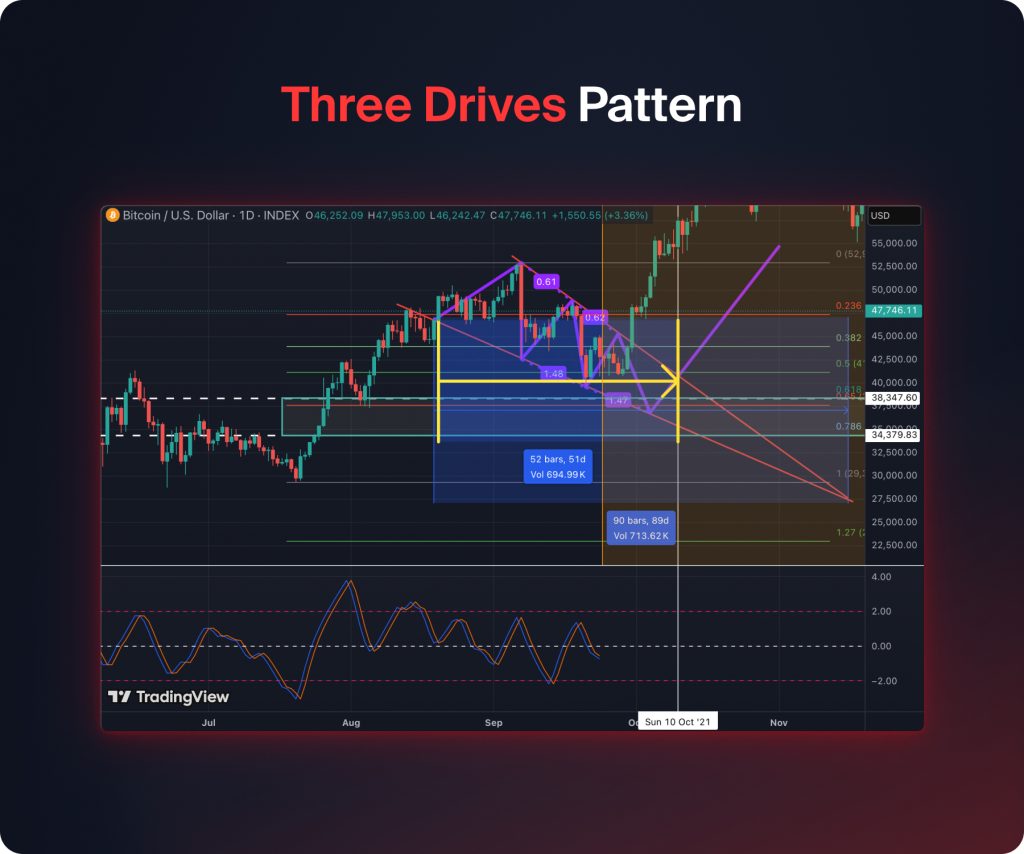
Como Negociá-lo
- Entrada: Entrar ao completar a terceira operação com um stop loss além da última oscilação.
- Os alvos de take profit podem usar retrações de Fibonacci ou níveis de estrutura anteriores.
48. Padrão de Dead Cat Bounce
O padrão de dead cat bounce é uma reversão de mercado em uma tendência de queda onde os preços se recuperam apenas temporariamente antes que a tendência continue em direção à baixa.
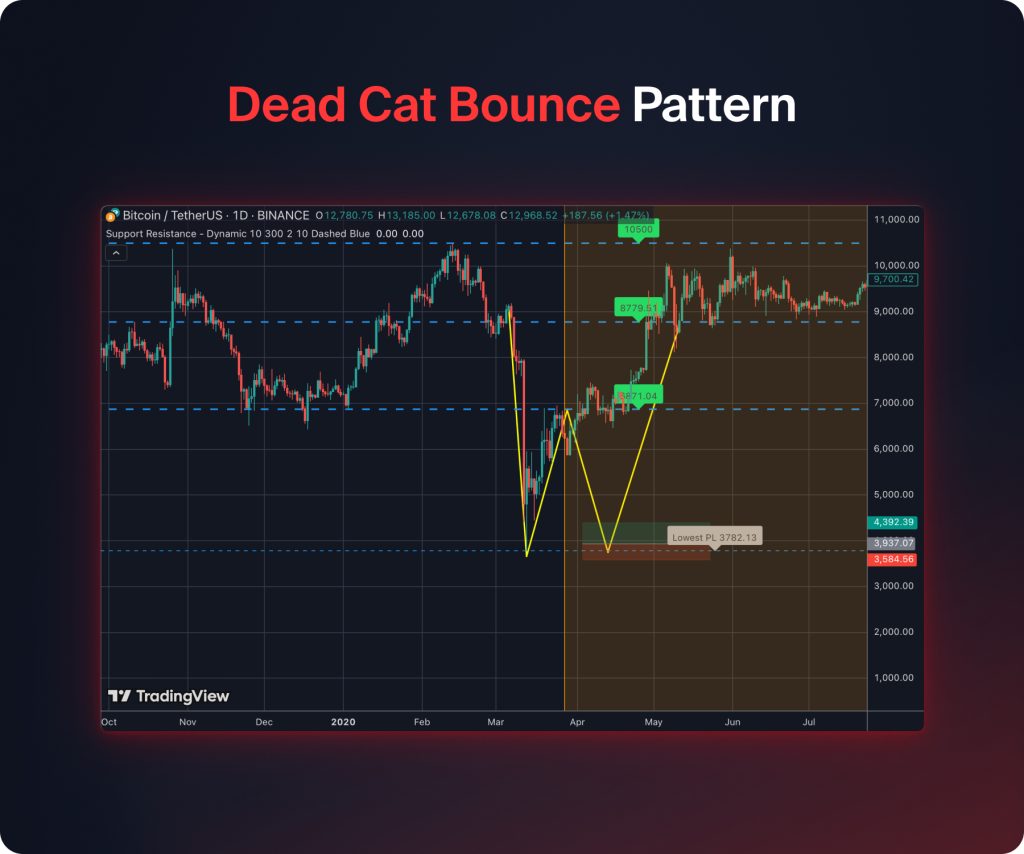
Como Negociá-lo
- Entrada: Operações curtas podem ser consideradas quando o repique esgotou seu momento de alta.
- Stop loss estaria acima do ponto mais alto do ressurgimento, e os alvos estão alinhados com a continuação descendente da tendência.
49. Padrão Shakeout
O Padrão Shakeout é onde o preço cai inicialmente para ativar as ordens de stop-loss e depois volta a subir, indicando manipulação de mercado por participantes mais fortes.
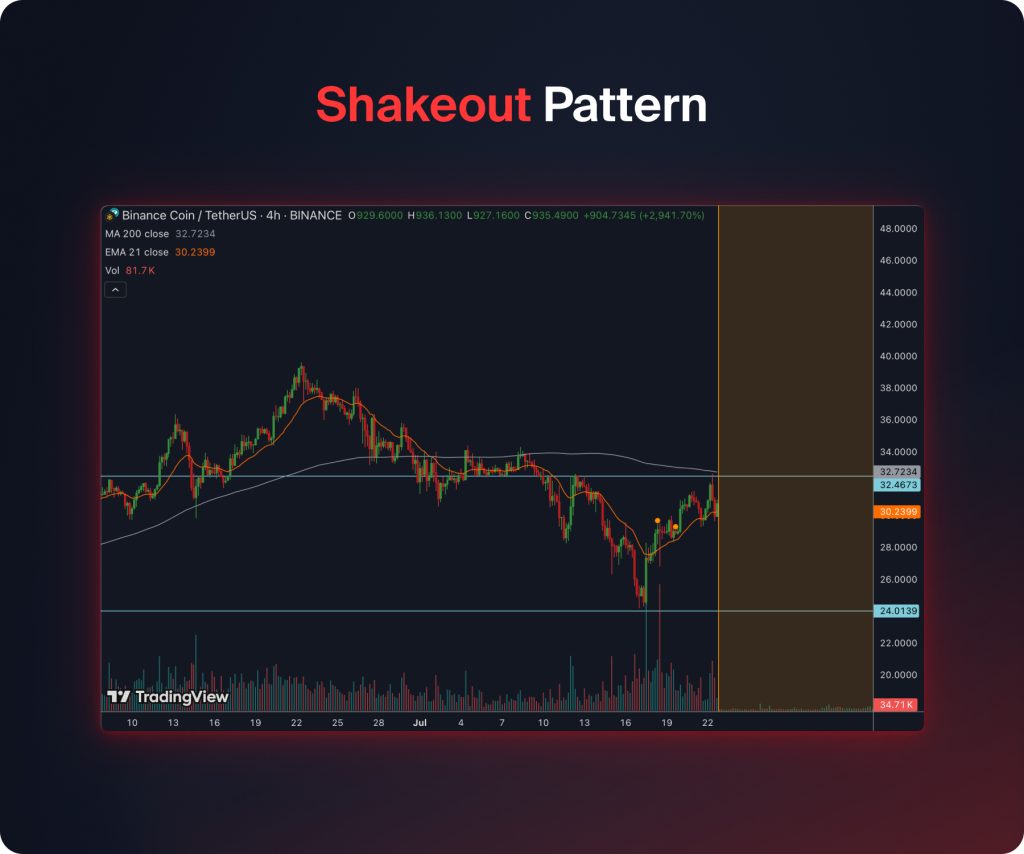
Como Negociá-lo
- A entrada é feita após a confirmação da reversão.
- Stop loss está abaixo do ponto mais baixo do shakeout.
- As metas de lucro seguem os níveis de resistência anteriores ou a continuação da tendência.
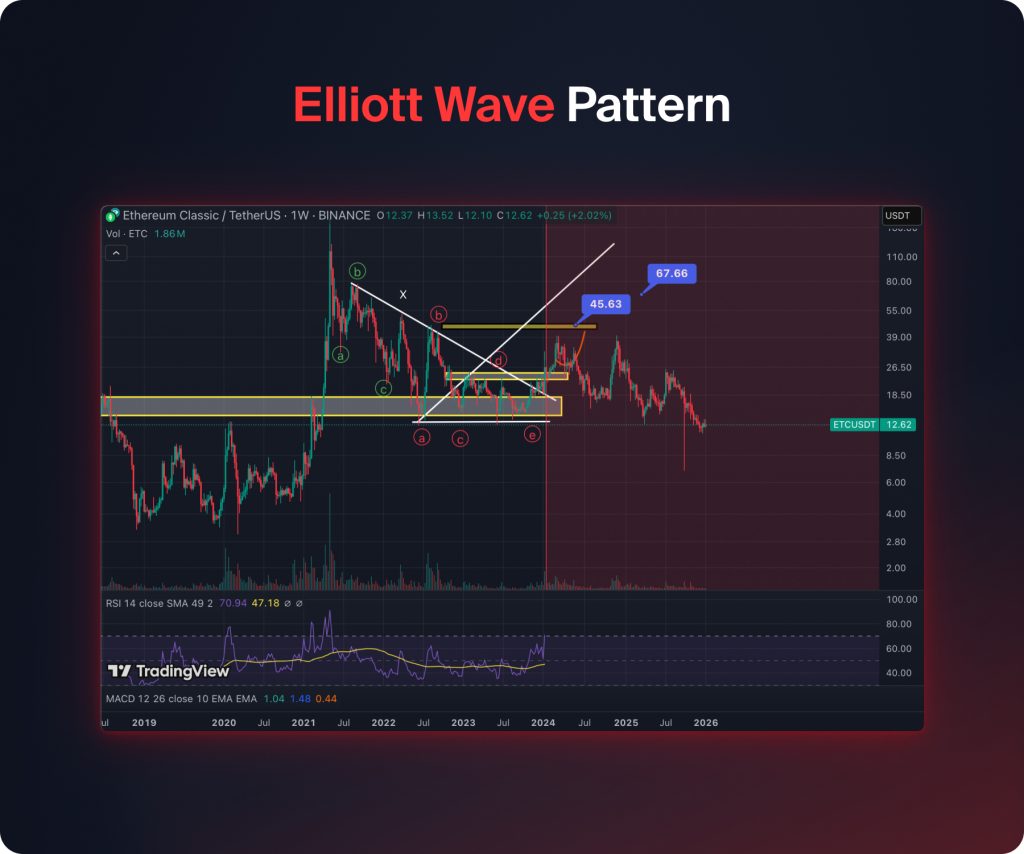
50. Padrão de Ondas de Elliott
O Padrão de Ondas de Elliott é um tipo de modelo comportamental e preditivo que utiliza uma série de ondas, tanto impulsivas quanto corretivas, para determinar tendências cíclicas. Ele reflete a psicologia coletiva do mercado.
Como Negociá-lo
- Entrada: Entre durante ondas impulsivas na direção da tendência primária.
- Stop loss é colocado além da onda corretiva anterior.
- Metas de lucro são baseadas em extensões de Fibonacci ou projeções de ondas.
Melhores Intervalos de Tempo para Padrões de Gráfico
A seleção do intervalo de tempo correto é uma consideração essencial para o sucesso na negociação usando padrões gráficos. Diferentes intervalos de tempo se adequam a diferentes estilos de negociação, e entender isso ajuda os traders a alinhar suas estratégias com o contexto do mercado.
- Scalping: Envolve trabalhar em gráficos muito curtos que variam de 1 a 5 minutos. Os padrões no gráfico são rápidos, mas podem ser ruidosos.
- Day Trading: Os traders usam gráficos de 15 minutos a 1 hora. Os padrões fornecem sinais de negociação mais confiáveis no trading intradia.
- Swing Trading: Usa gráficos de 4 horas a diários. Padrões são mais confiáveis e suportam metas de lucro maiores.
No entanto, negociar esses padrões gráficos em timeframes mais altos é mais confiável porque há menos ruído de mercado, ações de preço mais substanciais e maior confirmação de tendências. Além disso, os padrões em timeframes mais altos geralmente representam a participação institucional.
Erros Comuns que os Traders Cometem com Padrões de Gráficos
Até mesmo traders profissionais estão suscetíveis a armadilhas ao lidar com padrões de gráficos. A conscientização sobre essas armadilhas previne perdas e aumenta a precisão nas negociações.
1. Falta de Confirmação: Confiar apenas em padrões, sem confirmação de volume ou confirmação com outros indicadores, pode resultar em falha de padrão. Portanto, confirme os padrões com volume e outros indicadores técnicos.
2. Negociação Emocional: Deixar que o medo ou a ganância dirigam as decisões pode resultar em perseguir negociações ou manter perdedores por muito tempo. No entanto, você pode evitar isso seguindo seu plano de negociação e sendo disciplinado.
3. Padrões de negociação em isolamento: Confiar apenas em padrões de gráficos, em vez de considerar o contexto do mercado ou a tendência, pode resultar em negociações não lucrativas. Portanto, é imperativo examinar a estrutura geral do mercado e a tendência antes de realizar suas negociações. Padrões provavelmente não funcionarão quando analisados fora de contexto.
4. Gestão de Risco Deficiente: Mesmo que suas operações estejam alinhadas com os padrões de gráfico corretos e o contexto do mercado, sem uma gestão de risco adequada, você ainda pode ter prejuízos. Não definir stop losses adequados, alavancar excessivamente as posições ou mirar em pontos de take profit irreais pode prejudicar suas operações. Portanto, use stops e um dimensionamento de posição apropriado com base na estrutura do padrão e na volatilidade para gerenciar o risco.
5. Perseguindo o Mercado: Entrar em uma negociação após o padrão já ter se movido significativamente, perdendo a entrada ideal, é outro erro comum. No entanto, você deve esperar pela configuração e entrada adequadas.
6. Interpretando Erroneamente Falhas de Padrões: Não levar em conta o fato de que os padrões falham (20-30% do tempo) e se deixar levar por falsas quebras. Você deve aceitar perdas e gerenciar riscos quando os padrões não se concretizam.

