Back
Contents
Hanging Man Candlestick: Definition and Tactics

Vitaly Makarenko
Chief Commercial Officer

Demetris Makrides
Senior Business Development Manager
Hanging man is a reversal candlestick pattern that predicts the ongoing change from the uptrend movement to the downtrend one.
Key takeaways:
- What does a hanging man candlestick look like?
- How to understand the pattern properly?
- What are the pros and cons of the hanging man candlestick pattern?
- Which instruments and patterns are combined with hanging man?
- How to open orders based on the hanging man candlestick pattern?
What Is a Hanging Man Candlestick?
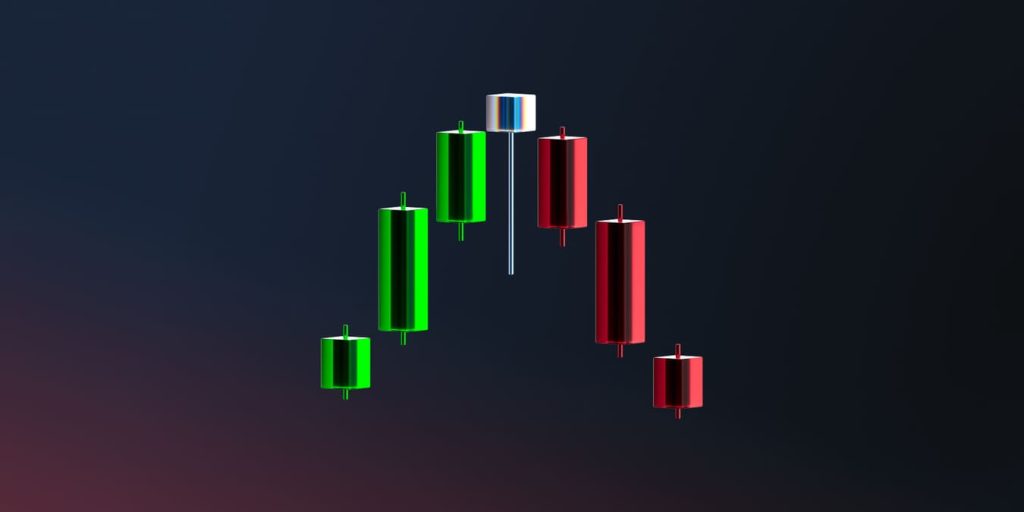
A hanging man candlestick pattern falls into the category of reversal patterns that appear on the top of the uptrend and inform a trader that an asset’s price gets closer to an unclimbable barrier and the bulls are exhausted enough and unable to move the price forward.
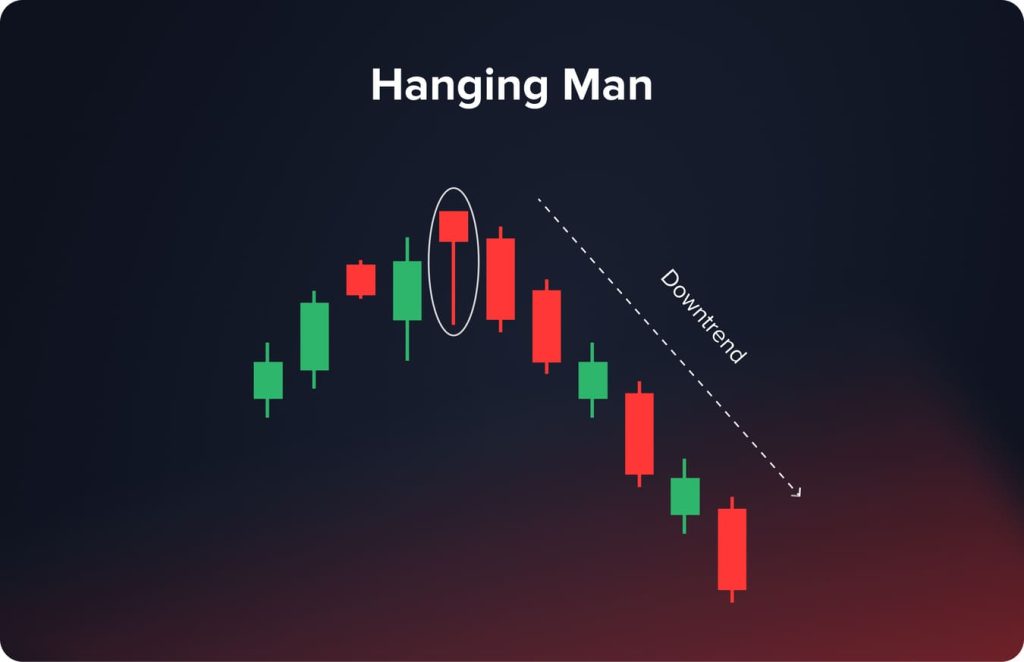
On a chart the pattern looks like a candlestick that has a small body and a long lower shadow. It is important that the candlestick color doesn’t matter – a hanging man can be both green (bullish) and red (bearish); in both cases the pattern refers to bearish reversal patterns.
When looking at the pattern, it resembles a hanging man with dangling legs; which is why the candlestick pattern gets such a nickname.
Characteristics of a Hanging Man Candlestick
Here are the most common characteristics that help traders identify a hanging man candlestick:
- The pattern appears only on the top of the uptrend.
- A small candlestick body is formed at the top of the price range.
- An upper shadow of the candlestick should be missing or barely noticeable.
- A lower shadow of the candlestick should be at least twice longer than its body.
Furthermore, a trader needs to understand that the smaller a candlestick body is and the longer its lower shadow is, the stronger is the reversal signal.
Such a candlestick pattern may appear in different financial markets and in diverse timeframes.
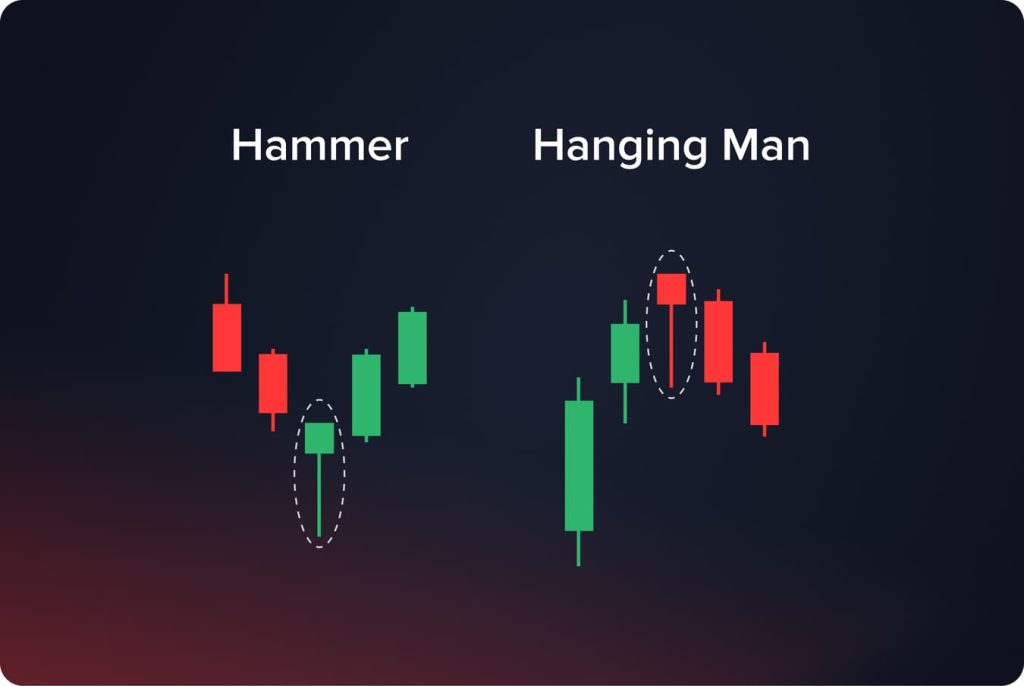
Note! A trader may find the same candlestick in the bottom of the bearish trend. With a small body, barely noticeable upper shadow, and a long lower shadow this candlestick has another nickname – “Hammer.” The difference between a hanging man candlestick and a hammer candlestick lies only in the position where the pattern appears.
When Does a Hanging Man Candlestick Pattern Appear?
Such a candlestick pattern means that the bullish trend comes to an end and predicts the ongoing trend reversal. Meanwhile, the pattern itself is not a 100% indication that an asset’s price is going to change its movement direction. Traders need to find some confirmation of the trend reversal.
For instance, a hanging man candlestick can appear as a part of the “Evening star” pattern, the three-candlestick bearish pattern. Furthermore, traders may also identify other patterns like “Shooting star” and “Bearish Engulfing” together with a hanging man candlestick.
Psychological Explanation of the Pattern Appearance
From the psychological viewpoint, the opening of trading starts at the highs. Within a day bears put significant pressure on an asset’s price that leads to sell-offs at the beginning and in the middle of a day. By the end of a trading session the bulls restore their positions somehow. At the same time, despite the bullish counterattacks the market is under the control of the bears.
The above-mentioned market situation is a bright explanation of what is going on when a trader identifies a hanging man candlestick on a chart.
In case the next day trading opens below the body of a hanging man candlestick, it means that many market players face losses. The pattern is understood as a signal for closing positions. Then a consequence of closures and liquidations happens and leads to a stronger price drop. As a result, the uptrend is changing to the downtrend.
The Combination of a Hanging Man Candlestick with Other Patterns
Professional traders get used to looking for confirmations before opening a position. What are the confirmations for the hanging man pattern?
The Evening Star Pattern
First and foremost, we need to understand what the evening star pattern consists of. It is the three-candlestick pattern.
- The first candlestick is a long bullish one.
- The second candlestick has a short body and can be both bullish and bearish. It reflects the uncertainty of the market.
- The third candlestick is marked by a long bearish body.
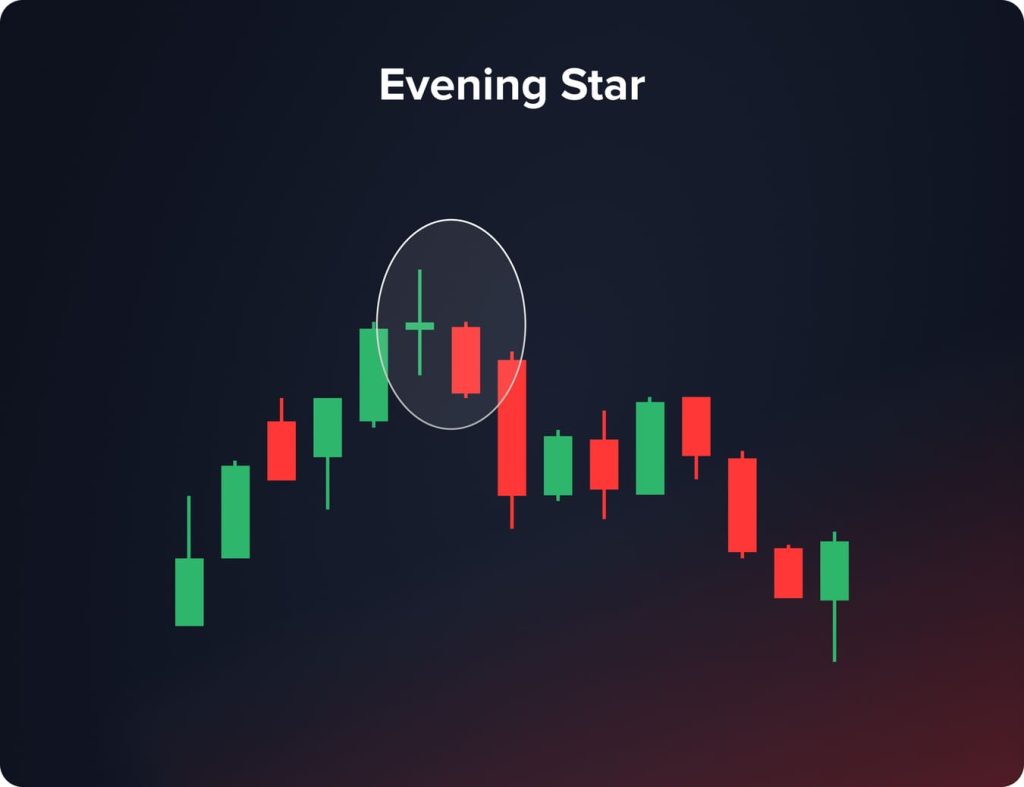
A hanging man candlestick can appear as the second element of the evening star pattern. In such a case this pattern is regarded as a strong signal for the future trend reversal.
The Double Top Pattern
Double top is another powerful bearish pattern that forms when an asset’s price reaches its highest peak two times and then moves in the opposite direction. When compared to other graphical patterns, the double top may include multiple candles. On a chart you may identify the inverted W.
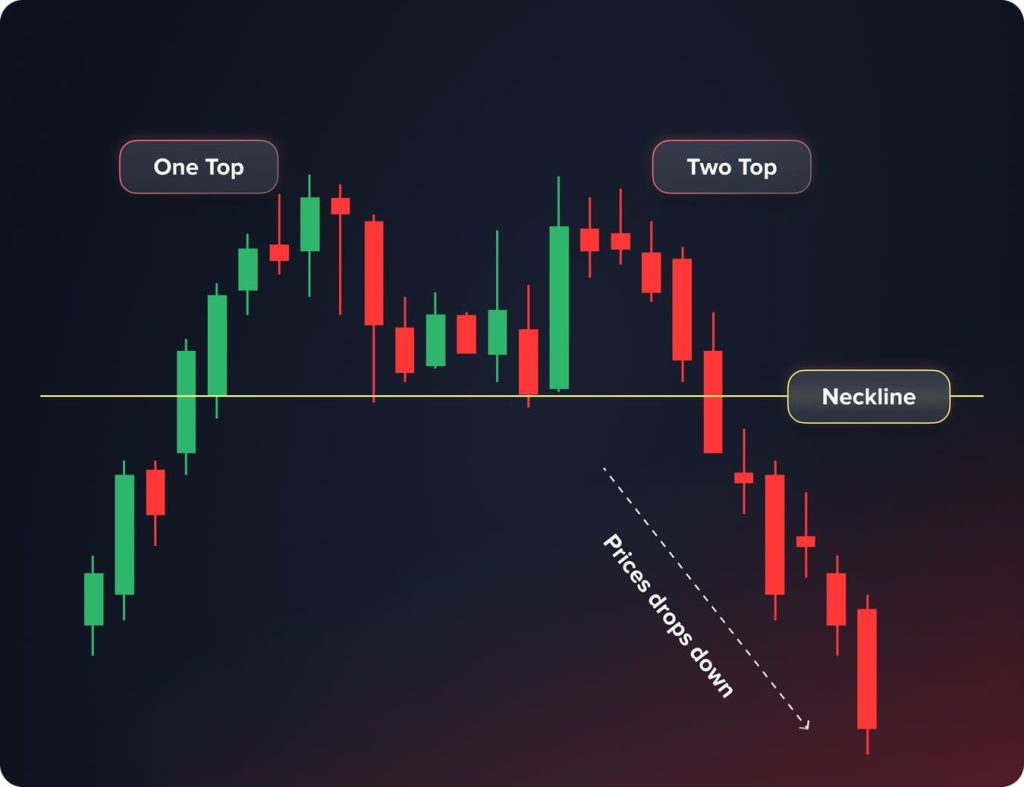
When hanging man candlesticks appear inside the double top pattern, the reversal signal is exceptionally strong.
The Combination of a Hanging Man with Bearish Marubozu and Bearish Harami
A bearish Marubozu candlestick is a candle with a long body that appears right after the bullish uptrend movement.
Harami is one more reversal candlestick that is marked by a small decrease in price. When talking about a bearish Harami, a candlestick is green and follows next to a red candlestick.
What about the role of a hanging man candlestick? It may appear after a bearish Marubozu and a bearish Harami. This combination informs traders that the trend is going to be changed to the descending one.
Characteristics that Strengthen the Hanging Man Candlestick Pattern
Apart from the combinations of a hanging man candlestick with other chart patterns, there are some factors that strengthen this signal. What are those factors?
- When there is a gap between a hanging man candlestick and a previous candle, the trend reversal is more obvious. The bigger that gap, the more possible the reversal movement is.
- The upper shadow of a hanging man candlestick should be missing or exceptionally short. In the traditional model of the pattern the candlestick has no upper shadow.
- The size of a candlestick body does matter. The smaller its body, the stronger the reversal signal is.
- The length of the lower shadow also does matter. The lower shadow should be at least twice longer than a candlestick body. The longer its lower shadow, the stronger the signal is.
- The potential of the bearish movement directly depends on the previous bullish trend. The more aggressive the previous bullish movement was, the more potential the bears get after the appearance of a hanging man candlestick.
- On the one hand, the color of a hanging man candlestick doesn’t matter. The pattern can be both green (bullish) and red (bearish), but on the other hand, a bearish candlestick is a much stronger signal that indicates a strong sellers’ pressure on the market.
The Pros and Cons of a Hanging Man Candlestick
Among the main pros of the pattern the following ones are pointed out:
- A hanging man candlestick helps traders find the best reversal point for opening positions.
- The pattern is much more effective on higher timeframes (e.g. H4 or D1 timeframes).
- The hanging man pattern falls into the category of classic reversal patterns which were applied in practice multiple times; which is why the accuracy of its signals is much higher when compared to other models.
- In most cases this pattern is effective enough without any other additional signals. Meanwhile, conservative traders rely on some more bearish signals before opening a position.
What are the weak points of a hanging man candlestick?
- The pattern can provide traders with false signals, especially when talking about low timeframes.
- Before opening a position based on the hanging man candlestick pattern, traders need to understand the whole market context.
- Traders may subjectively interpret this pattern, as every trader determines the strength and significance of the pattern on his own.
Technical Indicators to Confirm the Hanging Man Pattern
Apart from the graphical chart patterns, professional traders widely use technical indicators that confirm the signal given by a hanging man candlestick. Here are the top reversal indicators:
- RSI (Relative Strength Index). The indicator measures the speed and change of price movements, ranging from 0 to 100. Based on the RSI measurements, traders understand whether an asset is overbought or oversold.
- MACD (Moving Average Convergence Divergence). Such an indicator shows the interdependence between the two MAs and illustrates it as a histogram.
- Stochastic. It is an oscillator instrument that compares closing prices of an asset to its prices within a given period.
Core Steps to Identify the Pattern on the Chart
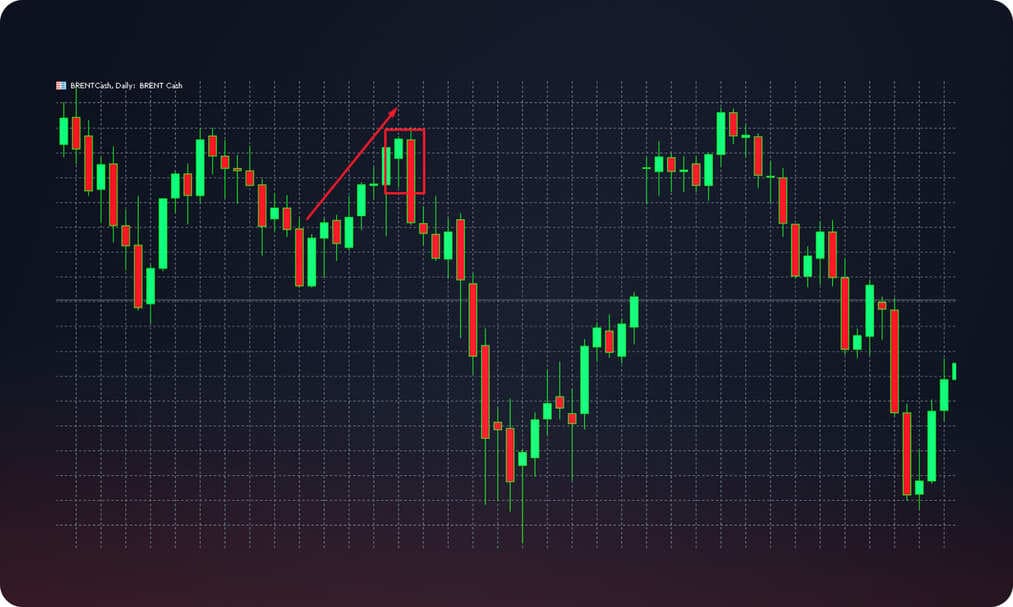
Let’s analyze how to identify this pattern on the chart. As an example we use the Brent price chart and the daily timeframe (D1).
Step 1. Identify the current bullish trend
Foremost, we need to find the well-formed bullish trend. Use tech analysis or other chart patterns to make sure that an asset’s price is moving within the upward trend.
Step 2. Find a hanging man candlestick
When the upward trend is identified, we need to find the hanging man pattern on its top. We see the hanging man candlestick on the top of the bullish trend. The candlestick has barely noticeable upper shadow, medium body, and long lower shadow. The color of the candlestick is green; which is why the signal is not strong enough.
Step 3. Get the signal confirmation and open a position
No matter how strong the signal is, professional traders need to find the confirmation through other patterns or reversal technical instruments.
For instance, we add the RSI instrument to understand whether a hanging man candlestick gives us a true or false signal.
The instrument shows the measurement of 61.61; which is why we make a conclusion that an asset is somehow overbought. Together with the RSI indicator the signal given by the hanging man candlestick is much stronger.
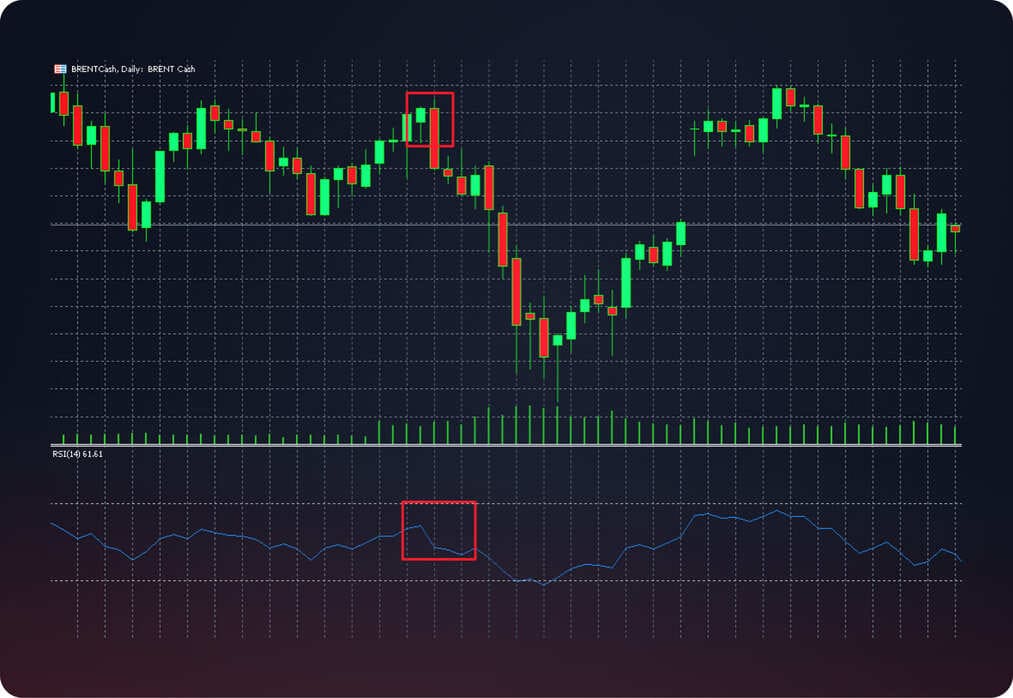
What is the best entry point for opening a position? Professional traders recommend to get the confirmation illustrated by the next bearish candlestick and then open a position. Set your stop-loss to the upper level of the hanging man candlestick body. As for the take-profit instrument, one may place it to the nearest resistance level.
The Bottom Line
Hanging man is a traditional reversal pattern that gives traders a strong signal predicting the ongoing change from uptrend to downtrend. The pattern itself is rather strong, especially on higher timeframes, but professional traders prefer to confirm the signal with the help of additional patterns and technical indicators.
FAQ
Hanging man falls into the category of traditional reversal patterns; which is why signals given by such a pattern are among the strongest ones. Nevertheless, professional traders recommend confirming the signals by additional patterns and instruments.
A hanging man candlestick can be a part of the Evening Star or of the Double Top that are strong reversal patterns. As for technical indicators, the pattern can be confirmed by RSI, MACD, and Stochastic instruments.
The pattern is exceptionally effective on all financial markets. As for timeframes, traders are recommended to use higher timeframes starting with the 4-hours one.
Updated:
February 3, 2025
9 February, 2026
What Is a Trading Halt? Why Stocks Stop Trading and What It Means for You
A trading halt is when an exchange temporarily stops trading in a stock or, in rare cases, the entire market. It’s not a glitch and it’s not random. It’s a deliberate pause triggered when prices move too fast, critical information is about to be released, or regulators need time to step in. From the outside, […]
