
Intraday trading means opening and closing a trade within the same trading day. The aim is to capture a short price move, then finish the session with no open position.
That sounds simple. The difficult part is not finding another chart setup. It is making a few good decisions while price, spreads, headlines, and your own attention keep moving.
For most people, intraday trading is not a faster version of investing. It is a separate job with its own costs and failure points. A trader has to know when the market is active, what makes a trade invalid, how much a losing trade costs, and when to stop for the day.
This is why a small, repeatable process usually beats a screen full of indicators.
Short Answer
An intraday trader opens and closes positions during one session. They may trade a breakout after an economic release, a pullback in a strong trend, or a reversal at a well-defined level. They do not carry that position into the next trading day.
Closing before the session ends avoids overnight price gaps. It does not make intraday trading low risk. Fast markets can still move through a stop order, and trading more often means paying the spread, commission, financing rules where relevant, and execution costs more often.
Investor.gov is blunt about it: day trading can produce substantial losses in a short time. That is not a reason to avoid learning how markets work. It is a reason to treat risk and execution as part of the strategy, not as an afterthought.
The Differences Between Basic Trading Styles
Different traders are characterized by different approaches on how to trade, how long to hold a position, and which trading instruments to use when analyzing further price movements. There are four basic trading styles:
- Scalp trading (scalping). Such a style implies holding a position for a very short period of time. Scalp traders hold positions from a few seconds to several minutes. This approach aims to open a lot of orders and take small but frequent profits. Traders need to be fully involved in the market, analyze the smallest price movements, and find the best points to enter and leave the market quickly.
- Day trading (intraday). The main rule of this trading style lies in closing all the positions before the markets close. Traders open and close their positions within one and the same trading session. They get profits from short-term market movements but have more time to analyze the market properly when compared to scalping.
- Swing trading. Such a style includes holding a position for several days or weeks. The main goal of a swing trader is to understand the current market trend and then take advantage of the movement. Traders are looking for either swing highs when an asset’s price rises or swing lows when the price drops down.
- Position trading. This approach is more like investments than trading, as you can hold a position for weeks, months, or even years. Short-term market fluctuations do not affect the predictions position traders make. They focus on long-term market trends and macroeconomic factors.
Key Features of Intraday Trading
- Traders open positions and need to close them within the same trading session.
- The main accent is put on the technical analysis instruments. Traders use combinations of indicators to understand whether an asset’s price is going to rise or fall down within the nearest periods of time.
- The amount of positions is rather high. Intraday traders usually open more than 10 positions and get small profits from each one.
- The average profit for a position is 2-3%.
- Traders utilize different asset classes to open their positions.
Who Is Intraday Trading Suitable For?
On the one hand, intraday trading is one of the widespread styles of opening and holding positions. On the other hand, traders need to understand whether such an approach suits their personal or not. When a trader selects the wrong style, they end up with heavy losses.
As such, what is a portrait of a successful intraday trader?
- A trader makes decisions quickly and is able to analyze large amounts of data in a short period of time.
- A trader is not influenced by stress when working under tight deadlines.
- A trader has a high level of stress resistance, is able to control emotions, and makes decisions with a cool head.
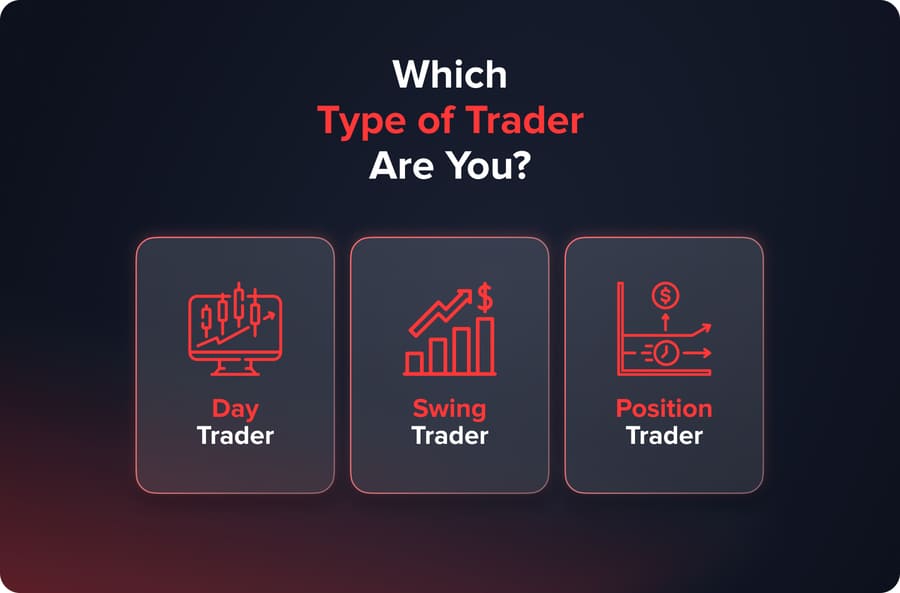
When the necessity to make quick decisions and analyze the market within tight deadlines leads to mistakes and stress, change your trading style to swing or position trading.
Is this intraday setup worth attention?
Move the inputs before taking a trade. The score rewards clean conditions and penalizes the things the article warns about: thin liquidity, high costs, news risk, and emotional pressure.
Intraday Trading Compared With Other Styles
| Style | Typical Holding Time | Main Focus | What Usually Goes Wrong |
|---|---|---|---|
| Scalping | Seconds to minutes | Small moves and fast execution | Costs and a few poor fills eat the expected edge. |
| Intraday trading | Minutes to one session | Session levels, news, momentum, and liquidity | Overtrading after a loss or trading during poor conditions. |
| Swing trading | Days to weeks | Multi-day moves and higher-timeframe structure | Holding too much size through overnight events. |
| Position trading | Weeks to months | Longer trends and fundamental themes | Confusing a damaged thesis with normal volatility. |
The best style is not the most exciting one. It is the one that fits the time you can give it and the decisions you can make well. Someone who only checks markets twice a day is usually forcing it when they try to scalp a five-minute chart.
Types of Intraday Trading
Intraday trading is a name of a trading style but at the same time it includes several types that differ in approaches, strategies, and possible profits. Here is the list of types of intraday trading:
- momentum trading;
- breakout trading;
- reversal trading;
- news-based trading;
Let’s dive deeper into each type of intraday trading to understand its peculiarities.
Momentum trading
Traders are looking for assets that are about to show strong price movements. Positions are opened in the direction of a current trend, upwards or downwards. The core goal is to ride the wave and wait until the trend is ready for reversal. Momentum trading can be used for all the assets but traders select stocks more often.
Breakout trading
This trading type is based upon the identifying support and resistance levels. Professional traders use different indicators to visualize the channel an asset’s price is moving inside. Those indicators are Keltner Channel, Donchian Channel, Bollinger Bands, and so on. When the price touches the upper or lower border of the channel, there is a high probability that it will go back to the channel. Meanwhile, breaking those borders is a signal for an upcoming trend. Traders open positions when an asset’s price breaks one of the channel borders.
Reversal trading
One trend is sooner or later changed by another one, and all the financial markets work according to this principle. Professional traders rely on technical analysis indicators and graphic patterns to identify price levels where an asset is overbought or oversold. As such, they open positions in the opposite direction waiting for the trend reversal. As for indicators that are used in reversal trading, RSI and Stochastic are the most widespread instruments. When talking about the category of graphic reversal patterns, it includes the Hammer, Hanging man, Shooting star, etc.
News-based trading
As it comes from the type’s name, traders ground their predictions on the news. They monitor key events that happen in financial markets (earnings reports, public presentations of major financial players, updates of different indexes, political, economic, and other events) and understand whether an asset’s price is going higher or lower. When talking about news-based trading, you need to make split-second decisions.
Indicators Used in Intraday Trading
Intraday trading is mostly based on technical analysis; therefore, professional traders rely on diverse indicators and patterns that help them understand further price movements.
Here are the most widespread indicators used in intraday trading:
- Moving Average. Moving averages smooth the price fluctuations and reduce market noises so that traders could understand what is the direction of a current trend. Traders set the necessary period to get a broader view of the ongoing trend.
- Bollinger Bands. The indicator consists of three lines where the central one is the SMA 20 (Simple Moving Average based on the 20-day period). Bollinger Bands show whether an asset is overbought or oversold.
- RSI (Relative Strength Index). Such an indicator is rather close to Bollinger Bands, as traders use the index to understand where an asset is overbought and oversold. RSI shows market situations in grades from 0 to 100.
- MACD (Moving Average Convergence Divergence). The indicator gives traders a signal whether a current trend is going to reverse or continue. The instrument is represented by a histogram that shows markers of bullish and bearish trends.
Effective Strategies for Intraday Trading
Combination of EMA, MACD, RSI
We need to add the MACD indicator with default settings. Then we use RSI leaving the default settings as well. As for Moving Average, add two MAs – Exponential Moving Average with a 7-day period and another EMA with a 26-day period. On the chart we get the following picture:
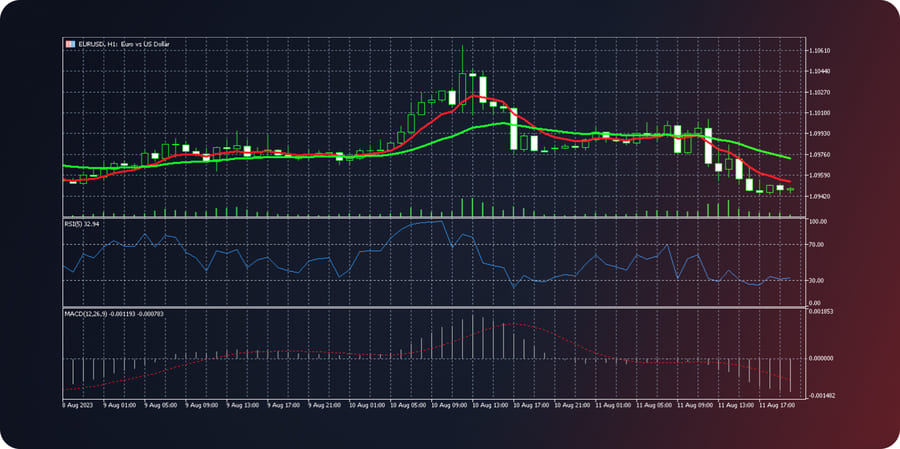
Open the positions according to the following criteria:
- EMA 7 crosses EMA 26 from the bottom to the top. The MACD index is going upwards, and the RSI index is higher than 50. Open a long position.
- EMA 26 crosses EMA 7 from the top to the bottom. The MACD index is going downwards, and the RSI index is lower than 50. Open a short position.
SLM Ribbon Strategy
Such a strategy is both simple and effective. You need to add Moving Average (exponential) indicators only. Select the EMA lines with 8-day period, 13-day period, and 21-day period.
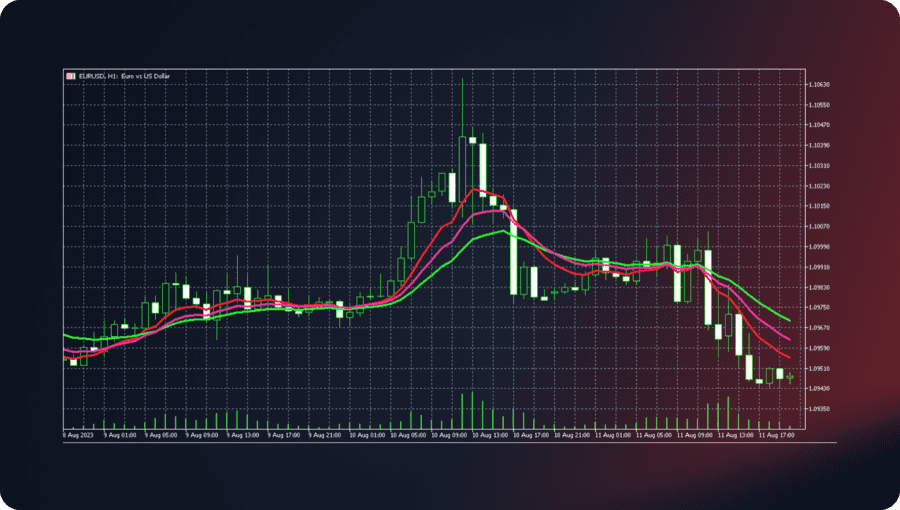
Open the positions according to the following criteria:
- EMA 8 crosses EMA 13 and EMA 21 lines from the bottom to the top. Open a long position on the candle next to the breakout one.
- EMA 8 crosses EMA 13 and EMA 21 lines from the top to the bottom. Open a short position on the candle next to the breakout one.
You may also like

Vitaly Makarenko
June 10, 2024
Combination of Parabolic SAR and Moving Average
Add Parabolic SAR leaving the default settings. Then utilize the SMA line with a 20-day period.
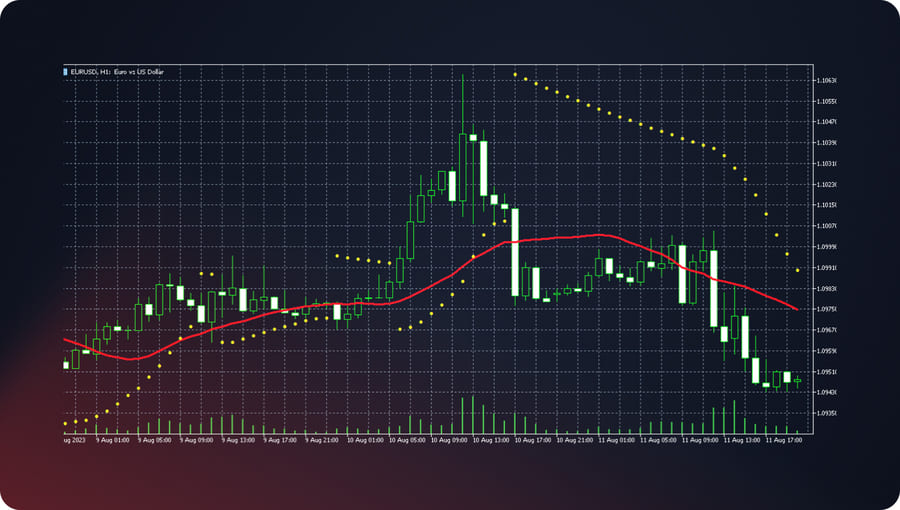
Open the positions according to the following criteria:
- When a bullish candle breaks the SMA 20 line and closes above it and Parabolic SAR confirms the signal (yellow circle below), open a long position.
- When a bearish candle breaks the SMA 20 line and closes below it and Parabolic SAR confirms the signal (yellow circle above), open a short position.
Pros and Cons of Intraday Trading
What are the main advantages and weak points of this trading style?
The main pros of intraday trading:
- Traders are able to get profits within one trading session. They earn from the smallest price fluctuations.
- Traders use minimum capitals due to high leverages. This trading style is possible from some $10-$20.
- Stop-loss and take-profit orders make it possible to control risks. Furthermore, traders do not hold their positions overnight; which is why they totally control their positions.
The cons of intraday trading are as follows:
- Intraday trading is rather complicated; this is why traders need to have profound knowledge of how technical analysis works.
- Low timeframes (M1, M5, M15, etc.) are characterized by frequent “noises”, and traders may get false signals.
- The style requires a trader to be able to analyze giant scopes of information and make quick decisions.
- Intraday trading is linked with the high load on analytical and emotional activity of a trader. There appears the risk of overtrading.
A Worked Intraday Example
The numbers below are illustrative. They show the decisions around a trade, not a recommendation to trade a particular asset.
Assume a trader is watching an index after the cash session opens. Price has spent the first 20 minutes in a narrow range. A stronger-than-expected economic number creates a break above that range, then price pulls back and holds above the breakout level.
| Decision | Illustrative Plan | Why It Matters |
|---|---|---|
| Entry | Buy only after the pullback holds above the opening range. | It avoids chasing the first fast candle. |
| Invalidation | Exit if price closes back inside the range and breaks the pullback low. | The original breakout idea is no longer holding. |
| Position size | Size the trade so the loss at the stop equals a pre-set amount. | The chart determines stop distance. The account determines size. |
| First target | Take some profit near the next visible resistance or a planned risk multiple. | It turns a vague hope into a defined decision. |
| Time stop | Exit if momentum does not develop within the planned window. | Capital and attention are tied up in a trade that is not behaving as expected. |
Notice what is missing: a promise that a moving average crossover will work. The trade depends on a condition, a defined failure point, and a manageable loss.
Does the expected move survive costs?
Enter entry, stop, target, spread, commission, and risk budget. The block sizes the trade from the stop first, then shows the reward-to-risk after estimated execution costs.
Expert Insight: A Setup Is Not Enough
In real trading reviews, the same setup can look profitable in one hour and terrible in another. The chart pattern has not changed. The surrounding conditions have.
A breakout in a liquid opening session, with a clear catalyst and steady volume, is not the same as a breakout in a quiet market just before a major announcement. Treating both as identical is a common way to get a strategy that works only in hindsight.
A daily loss limit should stop decisions, not just losses
Enter account size, daily loss limit, planned risk per trade, trades already taken, and today’s P&L. The block shows whether the session still has room for another decision.
Common Mistakes
Trading Every Movement
Price moves all day. Most moves are not a trade. More screen time can create the false feeling that something needs to be done.
Using A Fixed Position Size
Two charts can need different stop distances. Using the same size on both means the money at risk changes without a decision being made.
Chasing A Missed Entry
When price runs without you, the original entry no longer exists. Chasing it often leaves a worse reward-to-risk relationship and an emotional reason for the trade.
Adding To A Losing Position Without A Plan
Averaging down can be part of a defined strategy. Doing it because closing the trade feels bad is something else. If the original invalidation point is broken, adding size usually makes the decision harder.
Ignoring News And Market Hours
The same instrument can trade calmly in one hour and jump around in the next. A chart pattern has no obligation to survive an earnings release or a rate decision.
Bottom Line
Intraday trading is the practice of managing short-term opportunity and short-term risk at the same time. It is not about being busy. It is about being selective.
A trader needs a reason for entry, a point that proves the trade wrong, a size that keeps the loss tolerable, and a reason to stop for the day. Those basics are more valuable than a complicated strategy with perfect-looking historical results.

