Volver
Contents
¿Qué es el Barrido de Liquidez?: Todo lo que Necesitas Saber


Vitaly Makarenko
Chief Commercial Officer

Demetris Makrides
Senior Business Development Manager
Conclusiones Clave
- Las barridas de liquidez son operaciones grandes estratégicas diseñadas para activar órdenes de stop agrupadas y posiciones pendientes.
- Normalmente ocurren en los máximos/mínimos de oscilación, niveles de soporte y resistencia, y puntos de Fibonacci donde se acumulan clusters de liquidez.
- Los traders utilizan barridos de liquidez para confirmar la dirección de la tendencia, detectar reversiones o beneficiarse de las cacerías de stops por parte de jugadores institucionales.
- Para aumentar la precisión, siempre combina el análisis de barrido de liquidez con la estructura del mercado, el flujo de órdenes y los datos de volumen para descartar señales espurias y gestionar el riesgo.
¿Qué es un Barrido de Liquidez?
Dentro del marco del Concepto de Dinero Inteligente (SMC), un barrido de liquidez ocurre cuando jugadores del mercado a gran escala—como inversores institucionales o especuladores bien capitalizados—ejecutan operaciones significativas para activar órdenes de compra o venta pendientes en niveles de precios específicos.
Entender cómo estos movimientos interactúan con el flujo de órdenes y la dinámica del libro de órdenes es crucial, ya que revela cómo se apilan y absorben las órdenes por el mercado.
Estos flujos de liquidez del lado de compra y del lado de venta son típicamente impulsados por jugadores institucionales que buscan capturar órdenes atrapadas alrededor de niveles de precios clave.
La clave para entender los barridos de liquidez radica en identificar las zonas de liquidez. Estas zonas son áreas en los gráficos de trading donde existe una alta concentración de órdenes, incluidas las órdenes de stop-loss y las posiciones pendientes. Una vez que el precio las alcanza, es probable que se active un interés significativo de compra o venta.
Los participantes del mercado inteligentes pueden empujar el mercado hacia estas zonas de liquidez, creando un movimiento amplio que activa todas las órdenes acumuladas y genera impulso para el movimiento del precio en la dirección deseada. Esto se puede hacer para entrar en una posición de manera ventajosa o para salir de una existente, ya que los cambios repentinos en el precio pueden ofrecer oportunidades para ejecuciones de comercio favorables.
Ejemplo de Barrido de Liquidez
Escenario: Por ejemplo, el EUR/USD está atascado en 1.1000. Muchos traders minoristas han colocado órdenes de stop-loss justo por encima en 1.1010, esperando que la resistencia persista.
Una institución de repente ofrece a un precio de 1.1012, lo que llena esas órdenes de stop agrupadas. Este aumento crea un destello de liquidez de compra. Justo después de llenar esos stops, el precio cae repentinamente porque el gran jugador utiliza esa liquidez atrapada para vender en corto con un deslizamiento mínimo.
Este es un ejemplo de barrido de liquidez (o stop loss y take profit , también llamado cacería de stops) - el precio perfora brevemente un bolsillo de liquidez conocido, activa órdenes y retrocede de inmediato.
Barrido de Liquidez vs. Captura de Liquidez
Si bien un barrido de liquidez y una captura de liquidez sirven para propósitos ligeramente diferentes, comparten conceptos similares. Un barrido de liquidez implica movimientos de precios de amplio espectro que desencadenan un gran volumen de órdenes a través de una variedad de precios. En contraste, una captura de liquidez es generalmente más enfocada y ocurre durante una duración más corta, con el precio alcanzando rápidamente un nivel específico para activar órdenes mientras minimiza deslizamiento durante la ejecución de órdenes antes de cambiar de dirección.
Así, mientras que un barrido de liquidez representa un movimiento amplio del mercado, una captura de liquidez es más quirúrgica y específica. Ambas tácticas explotan concentraciones de órdenes dentro de áreas de liquidez identificadas para beneficio.
Barrido de Liquidez vs Caza de Stop vs Captura de Liquidez
Podemos tener aquí un gráfico de comparación de tres paneles con un barrido que muestra un movimiento amplio a través de la zona, la captura = mecha afilada tocando un bolsillo, y la caza de stops = pequeño pico atrapando stops minoristas.
| Término | Definición | Alcance | Duración |
| Barrido de Liquidez | Movimiento de precio extenso que desencadena un gran grupo de órdenes dentro de una zona | Amplio | Medio |
| Agarre de Liquidez | Cambio abrupto que se enfoca en un bolsillo específico de liquidez y revierte | Altamente concentrado | Corto |
| Caza de Stops | trampa que se establece para activar los stop-loss de los minoristas, y luego revertir | Concentrado | Corto |
Resumen rápido
- Los barridos de liquidez son amplios y orientados a tendencias
- Las capturas de liquidez son de corto plazo y específicas
- Las detenciones son trampas cuidadosamente dirigidas para hacer caer posiciones minoristas
Cómo Identificar Barridos de Liquidez en el Mercado
Para identificar de manera efectiva los barridos de liquidez, uno debe saber dónde se está acumulando la liquidez en los gráficos de trading. Una zona de liquidez se convierte en un terreno de caza preferido para los participantes del mercado que esperan movimientos de precios dramáticos.
Altos y Bajos de Swing
Mientras que los máximos swing son puntos entre dos mínimos sucesivos, mínimos swing son puntos entre dos máximos sucesivos. Por lo general, las zonas de liquidez significativas suelen aparecer alrededor de estos máximos y mínimos swing—picos y valles dentro de la acción del precio del mercado donde los traders típicamente establecen órdenes de stop-loss y posiciones de compra o venta pendientes para capturar niveles potenciales de soporte o resistencia. Cuanto más cerca esté el precio de estas áreas críticas, mayor será la probabilidad de barrer las órdenes de liquidez establecidas allí.
Niveles de Soporte y Resistencia
Los niveles de soporte son áreas en el gráfico que han demostrado a lo largo del tiempo prevenir cualquier caída adicional en el precio, mientras que los niveles de resistencia impiden que los precios suban más. Los indicadores técnicos de trading históricos como los niveles de soporte y resistencia son indicadores clave a tener en cuenta. Estos niveles han influido consistentemente en la dirección del mercado a lo largo del tiempo y a menudo son superados antes de rebotar, al igual que imanes que atraen órdenes de traders que buscan involucrarse en estos niveles establecidos. La liquidez puede acumularse significativamente alrededor de estas zonas.
Niveles de Fibonacci
Los niveles de Fibonacci, comúnmente utilizados en el análisis técnico, también se consideran zonas de liquidez potencial. Los traders a menudo colocan órdenes alrededor de estos niveles, viéndolos como puntos importantes de retroceso o extensión. La agrupación de órdenes alrededor de los niveles de Fibonacci puede convertirlos en objetivos atractivos para barridos de liquidez.
You may also like

Observando el Comportamiento de Precios en Zonas de Liquidez
Para identificar un posible barrido de liquidez, monitorea el comportamiento del precio a medida que se acerca e interactúa con las zonas de liquidez identificadas. Busca movimientos repentinos y bruscos que se extiendan más allá de los niveles establecidos, a menudo acompañados de un aumento notable en el volumen de negociación. Esta violación decisiva de una zona de liquidez es un fuerte indicador de que un barrido puede estar en progreso.
Además, observe la respuesta del mercado después de que el precio haya atravesado el área de liquidez. Si la acción del precio tiende a desacelerarse o sugiere una posible reversión, indica una barrida de liquidez exitosa y que el mercado está absorbiendo el impacto del movimiento repentino.
Analizando el Flujo de Órdenes y la Estructura del Mercado
Analizar el flujo de órdenes y la estructura del mercado utilizada por traders prop proporciona una mayor claridad sobre los posibles barridos de liquidez. Al monitorear la actividad entre inversores minoristas, jugadores institucionales y creadores de mercado, se puede entender las fuerzas que impulsan la acción del precio.
También puedes identificar la estructura de precios y el comportamiento del spread en los bloques de órdenes: áreas en el gráfico donde la compra o venta histórica fue lo suficientemente intensa como para influir en la dirección del activo. Cuando el precio se acerca a un bloque de órdenes dentro de una zona de liquidez identificada, la probabilidad de un barrido aumenta porque los participantes del mercado pueden estar apuntando a estas áreas para desencadenar movimientos de precios adicionales.
Cómo Encontrar Zonas de Liquidez en Tu Gráfico
Una infografía paso a paso
Haga lo siguiente para localizar dónde es más probable que haya grandes agrupaciones de órdenes esperando: los objetivos de mayor probabilidad para barridos de liquidez:
Marca los recientes máximos y mínimos de oscilación
Encuentra los precios más altos y bajos recientes en tu gráfico. Estas son áreas estándar para colocar órdenes de stop-loss.
Dibuja líneas horizontales donde haya soporte/resistencia firme
Atención a las áreas que mantuvieron el precio de manera constante en el pasado; atraen órdenes de descanso.
Superposición de retrocesos de Fibonacci
Niveles clave de Fibonacci del proyecto (38.2%, 50%, 61.8%) de la reciente acción del precio para ver dónde tienden a agruparse las órdenes.
Nota sobre los posibles clusters de stop-loss
Vea las áreas de precio justo por encima de los máximos anteriores o por debajo de los mínimos anteriores, donde se quedan atrapadas las órdenes de los minoristas.
Marcar áreas de superposición
Donde el soporte/resistencia, los puntos de oscilación y los niveles de Fibonacci convergen, márcalos como áreas de liquidez de alta probabilidad.
Consejo: Mantén estas áreas marcadas en tu gráfico como "áreas de vigilancia." El precio que se mueve hacia ellas con fuerza tiende a señalar una probable barrido de liquidez.
Cómo Aprovechar las Barridas de Liquidez en Estrategias de Trading
1. Opera en la Dirección de la Tendencia Actual del Mercado
Lo primero que necesitas hacer con la aplicación de los barridos de liquidez es establecer tu dirección analítica hacia la tendencia actual del mercado. Tendrás que identificar primero la dirección de la tendencia predominante, ya que eso te da contexto sobre dónde es más probable que ocurran los barridos de liquidez. En primer lugar, observa la serie de máximos más altos y mínimos más altos o máximos más bajos y mínimos más bajos que te dan una idea de la estructura y tendencia general del mercado.
Solo después de que tengas una buena idea de la tendencia, te concentras en dónde podrían estar las posibles zonas de liquidez en ese contexto. Como se mencionó anteriormente, se pueden identificar esas zonas observando los máximos y mínimos de oscilación, el soporte y la resistencia, y también los niveles de retroceso de Fibonacci. Al identificar estas concentraciones de órdenes, estarás mejor posicionado para anticipar y reaccionar a posibles barridos de liquidez.
2. Utiliza Bloques de Orden y Gaps de Valor Justo
Integrar bloques de órdenes y huecos de valor justo en la estrategia de barrido de liquidación puede llevar tu metodología de trading al siguiente nivel. Los bloques de órdenes son zonas específicas en el gráfico que registraron compras o ventas en el pasado con suficiente intensidad como para influir en la dirección que toma el activo.
Dependiendo de la dirección del mercado, se espera que apliques el bloque de órdenes apropiado: bloques de órdenes alcistas en un mercado alcista y un bloque de órdenes bajistas en un mercado bajista. Tales bloques pueden actuar como puntos de interés en el futuro, pues bien podría ser que el mercado regrese a ellos por un renovado interés por parte de los traders.
Por otro lado, los huecos de valor justo se refieren a áreas del gráfico que los movimientos de precios anteriores habían pasado rápidamente por alto. A menudo, estos huecos actúan como imanes para atraer el precio hacia ellos y llenar el valor faltante. Al encontrar los bloques de órdenes bien más allá de las zonas de liquidez y la presencia de un hueco de valor justo alrededor, puedes aumentar la probabilidad de predecir correctamente y, por lo tanto, capitalizar la ocurrencia de una barrida de liquidez.
Sería un buen momento para colocar órdenes límite en el bloque y un stop-loss justo más allá de él si el precio entra en el bloque de órdenes identificado, barriendo así la liquidez. La razón de esto es que tal estrategia normalmente se basa en la expectativa de que un bloque de órdenes desencadenará una reversión en la acción del precio a medida que el mercado absorba el impacto del movimiento repentino del precio.
El barrido de liquidez en un bloque de órdenes no solo activa la posible reversión, sino que también te brinda una mayor confianza en tu posición de trading. Esto se debe a una comprensión de que el impulso del mercado requerido para alcanzar y reaccionar en el bloque ha sido respaldado por el barrido de liquidez.
3. Operando en barridos de liquidez
La ocurrencia del barrido de liquidez te brinda más confianza en tu configuración de comercio. El hecho de que hubo un movimiento agudo y decisivo que activó el grupo de órdenes en la zona de liquidez sugiere un poderoso impulso subyacente del mercado, lo que aumenta las posibilidades de un resultado exitoso en el comercio.
La incorporación de barridos de liquidez en las estrategias de trading es, por cierto, un proceso perfeccionado con la práctica y el refinamiento, además del aprendizaje continuo. Notarás que a medida que adquieras más experiencia en la identificación e interpretación de estos fenómenos del mercado, serás capaz de ajustar tu enfoque de trading a diferentes condiciones del mercado y optimizar aún más tus resultados.
Recordatorios de Gestión de Riesgos al Operar Barridos de Liquidez
Operar en o cerca de barridos de liquidez puede ser increíblemente rentable, pero peligroso si se hace sin cuidado. Utiliza estas estrategias de gestión de riesgos para proteger tu capital:
- Siempre coloca órdenes de stop-loss duras justo más allá del área de liquidez deseada para limitar la pérdida potencial si el movimiento continúa.
- Reduce el tamaño de la posición durante períodos de alta volatilidad, ya que los barridos pueden producir picos repentinos y deslizamientos.
- Espera la confirmación (como velas de rechazo o caída de volumen) después de la barrida para entrar. Entrar durante la barrida puede exponerte a falsas rupturas.
- Evite operar en eventos de noticias significativas, cuando las barridas son más frecuentes pero menos predecibles y tienden a estar guiadas por fundamentos en lugar de técnicos. Tal volatilidad puede ser compensada por técnicas de cobertura en el trading para limitar la exposición.
- Establece relaciones de riesgo-recompensa realistas (como 1:2 o mejor) para que cada operación sea coherente con tu estrategia general.
Conclusión: Trata las barridas de liquidez como oportunidades de alto riesgo y alta recompensa, y siempre mantén el control del riesgo como una prioridad sobre las ganancias rápidas.
Errores Comunes que Cometen los Traders con los Barridos de Liquidez
Incluso los traders experimentados malinterpretan las barridas en la liquidez. Evita los errores típicos que llevan a la pérdida:
- Entrar demasiado pronto sin verificación
Entrar a medida que el precio se acerca a una zona, antes de que se haya producido el barrido, tiende a ser detenido en algún lugar del pico.
- Falta de tendencia direccional general
Tomar posiciones contrarias a la tendencia simplemente debido a un probable movimiento aumenta el riesgo. Siempre posiciona según la estructura del mercado subyacente.
- Omitir el análisis de volumen o flujo de órdenes
Un verdadero barrido suele ir acompañado de un aumento en el volumen. Sin ello, el movimiento puede ser nada más que ruido promedio del mercado.
- Exceso de apalancamiento durante barridos volátiles
El apalancamiento en altos niveles multiplica las pérdidas si el barrido contra tu posición continúa. El uso excesivo de margen puede magnificar las pérdidas, así que revisa los riesgos del trading con margen antes de aumentar el tamaño de las posiciones.
- Confundir la volatilidad normal con un barrido
No todas las velas altas son barridos de liquidez. Busca el contexto: fondos de liquidez conocidos, concentración de stops y reacción del mercado después del movimiento.
Consejo: Desarrolla una lista de verificación basada en reglas antes de entrar en operaciones en áreas de liquidez para eliminar configuraciones falsas y preservar tu cuenta.
Mejores Indicadores y Herramientas para la Identificación de Barridos de Liquidez
La identificación de barridos de liquidez temprana requiere las mejores herramientas para rastrear dónde hay grandes órdenes pendientes y cómo reacciona el precio a su alrededor. Los siguientes indicadores son capaces de hacer eso:
Indicadores de Perfil de Volumen
Revelar nodos de alto volumen donde es probable que los clústeres de liquidez permanezcan, lo que significa objetivos de barrido probables.
Gráficos de Huella / Herramientas de Flujo de Orden
Revela la presión de compra y venta en tiempo real en cada nivel de precio, para que puedas ver cuándo surgen órdenes agresivas.
Indicadores de Estructura del Mercado
Indique rupturas de máximos y mínimos - puntos de activación clásicos para barridos de liquidez.
Herramientas de Volumen de Sesión y VWAP
Detectar zonas de actividad institucional, que señalan dónde los grandes actores pueden defender o atacar zonas de liquidez.
Mapas de Calor de Stop-Loss (si tu plataforma los soporta)
Visualiza dónde es más probable que se concentren las paradas de venta al por menor, lo que te permitirá anticipar intentos de barrido.
Consejo profesional: Utiliza al menos una herramienta basada en volumen y una herramienta basada en estructura para verificar los barridos con mayor precisión.
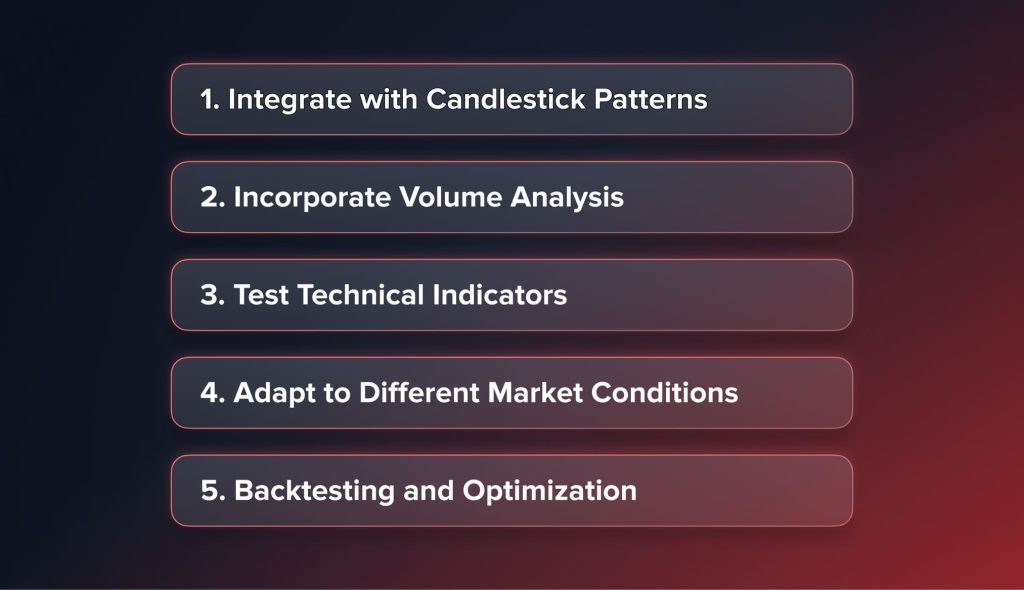
Estrategias Avanzadas de Barrido de Liquidez

1. Integrarse con Patrones de Velas
Una de las formas en que puedes refinar tus estrategias basadas en el barrido de liquidez es combinándolas con varios patrones de velas. Ciertas formaciones de velas, como los patrones envolventes, líneas de penetración o cubiertas de nubes oscuras, brindan una confirmación adicional de que puede ocurrir un barrido de liquidez. Ahí es donde la acción del precio se encuentra con una señal de vela, aumentando así tu confianza en la decisión de trading que vas a tomar.
2. Incorpora el Análisis de Volumen
También puedes obtener una serie de conocimientos al integrar el análisis de volumen en tu estrategia de barrido de liquidez. Al monitorear el volumen de negociación durante el barrido, podrás tener una idea de cuán fuerte es el movimiento del precio y con cuánta convicción ha tenido lugar el movimiento. Aumentos grandes en el volumen durante el barrido sugerirían que puede estar ocurriendo un evento de mercado más significativo, lo que podría resultar en una reversión o continuación más significativa.
3. Probar Indicadores Técnicos
También puedes enriquecer tu comprensión sobre cómo utilizar indicadores técnicos para complementar tu análisis de barrido de liquidez, ya sean osciladores de momento o herramientas de seguimiento de tendencias. Por ejemplo, las divergencias entre la acción del precio y los indicadores en el momento en que ocurre un barrido de liquidez pueden indicar oportunidades de reversión potenciales, o mostrar la importancia del evento del mercado.
You may also like

4. Adaptarse a Diferentes Condiciones del Mercado
Aunque todos los principios subyacentes de las barridas de liquidez siguen siendo los mismos, debes adaptar tus enfoques a las diversas fases del mercado. Si la volatilidad es alta, por ejemplo, es posible que desees realizar algunos cambios en los criterios de entrada y salida, ya que la acción del precio puede volverse mucho más aleatoria. Ser capaz de reconocer el vaivén de la liquidez en estas condiciones te ayudará a navegar mejor por los mercados.
Por el contrario, en mercados de baja liquidez, la dinámica de los barridos cambiará mucho, y es posible que debas ser más selectivo al identificar y tomar posiciones. En estas condiciones, los efectos de un barrido se verán amplificados, causando movimientos más grandes en los precios, pero a su vez, podrías sufrir un mayor deslizamiento y una ejecución complicada.
5. Pruebas retrospectivas y optimización
Finalmente, las estrategias avanzadas de barrido de liquidez solo pueden ser eficientes cuando hay un proceso adecuado de backtesting respaldado por la optimización. Tienes la oportunidad de analizar el rendimiento de tus diversas estrategias con datos históricos de mercado en profundidad, definir formas de mejorarlas y ajustar aún más el enfoque hacia tu trading.
Observe varias métricas de rendimiento durante la fase de retroceso: tasas de ganancia, ratios de riesgo-recompensa y retrocesos. Esto proporcionará una mayor comprensión sobre cómo ajustar de manera óptima los criterios de entrada y salida, el tamaño de las posiciones y la idoneidad de las estrategias basadas en barridos de liquidez para las condiciones de mercado prevalecientes.
Conclusión
Si hay una pieza muy importante del rompecabezas, entonces esa tiene que ser las barridas de liquidez dentro de este mundo dinámico y en constante cambio del trading. Entender e identificar correctamente tales movimientos estratégicos del mercado te brindará una mejor visión de las fuerzas subyacentes que impulsan la acción del precio y te convertirá en un trader mucho mejor informado, por lo tanto, potencialmente rentable.
Acompañar tu arsenal de trading con barridos de liquidez mejorará la identificación de tendencias, la utilización de bloques de órdenes, la utilización de brechas de valor justo y, en general, toda la ejecución de operaciones. Será a través de alinear tus estrategias con la tendencia del mercado predominante y colocar órdenes alrededor de las zonas de liquidez identificadas de tal manera que se mejoren tus ratios de riesgo-recompensa, aumentando así tu probabilidad de resultados favorables en las operaciones.
FAQ
¿Cuál es la diferencia entre un barrido de liquidez y una captura de liquidez?
Una barrida de liquidez implica un movimiento de precios más extenso que activa un gran volumen de órdenes a lo largo de un rango de precios, mientras que una captura de liquidez es un movimiento más enfocado y a corto plazo en el que el precio rápidamente alcanza un nivel para ejecutar órdenes antes de revertir la dirección.
¿Cómo encuentro zonas de liquidez potencial en el gráfico?
Las áreas potenciales de liquidez se pueden estimar buscando picos/valles, niveles de soporte/resistencia, niveles de Fibonacci y otros niveles de precios donde es más probable que haya una alta concentración de órdenes pendientes.
¿Puedo usar barridos de liquidez en mercados tanto en tendencia como en rango?
Sí, puedes potencialmente utilizar barridos de liquidez tanto en mercados en tendencia como en mercados laterales. Podrías utilizar los mercados en tendencia para alinear tus estrategias con la dirección de la tendencia predominante y buscar zonas de liquidez dentro del contexto de la tendencia. En mercados laterales, identificarás niveles de soporte y resistencia potenciales como zonas de liquidez y operarás en consecuencia.
Actualizado:
17 de septiembre de 2025

